
Next-Generation Digital Histopathology of the Tumor Microenvironment
by
 , ,
, ,
Felicitas Mungenast
1,2,* ,
,
Achala Fernando
3,4,
Robert Nica
2,
Bogdan Boghiu
5,
Bianca Lungu
5,
Jyotsna Batra
3,4 and
Rupert C. Ecker
2,3,4,* 1
Institute of Pathophysiology and Allergy Research, Center for Pathophysiology, Infectiology and Immunology, Medical University of Vienna, 1090 Vienna, Austria
2
TissueGnostics GmbH, 1020 Vienna, Austria
3
Translational Research Institute, 37 Kent Street, Woolloongabba, QLD 4102, Australia
4
School of Biomedical Sciences, Faculty of Health, Queensland University of Technology, Brisbane, QLD 4059, Australia
5
TissueGnostics SRL, 700028 Iasi, Romania
*
Authors to whom correspondence should be addressed.
Genes 2021, 12(4), 538; https://doi.org/10.3390/genes12040538
Submission received: 11 March 2021
/
Revised: 30 March 2021
/
Accepted: 1 April 2021
/
Published: 7 April 2021
(This article belongs to the Special Issue Genetic Complexity of Hormone Sensitive Cancers)
Abstract
:Progress in cancer research is substantially dependent on innovative technologies that permit a concerted analysis of the tumor microenvironment and the cellular phenotypes resulting from somatic mutations and post-translational modifications. In view of a large number of genes, multiplied by differential splicing as well as post-translational protein modifications, the ability to identify and quantify the actual phenotypes of individual cell populations in situ, i.e., in their tissue environment, has become a prerequisite for understanding tumorigenesis and cancer progression. The need for quantitative analyses has led to a renaissance of optical instruments and imaging techniques. With the emergence of precision medicine, automated analysis of a constantly increasing number of cellular markers and their measurement in spatial context have become increasingly necessary to understand the molecular mechanisms that lead to different pathways of disease progression in individual patients. In this review, we summarize the joint effort that academia and industry have undertaken to establish methods and protocols for molecular profiling and immunophenotyping of cancer tissues for next-generation digital histopathology—which is characterized by the use of whole-slide imaging (brightfield, widefield fluorescence, confocal, multispectral, and/or multiplexing technologies) combined with state-of-the-art image cytometry and advanced methods for machine and deep learning.
1. Introduction
Cancer is a crucial global health challenge. The incidence of new cancer cases is predicted to increase by around 70% over the coming two decades [1]. Due to the idea that cancer originates from a deranged genome, exploring the genomic, transcriptomic, and proteomic nature of cancer is vital for understanding and utilizing remedies for the treatment of cancer [2]. The tumor cells and the surrounding microenvironment, which includes various types of immune cells, signaling cells and molecules, fibroblasts, and the extracellular matrix comprised of adjacent blood vessels, are highly interdependent compartments. We have started to understand the complex interplay between each of these compartments, with the tumor itself shaping and directing its surroundings—the tumor microenvironment (TME)—while at the same time obtaining signals from this microenvironment for further progression [3]. It is often believed that cancer seeds are germinated primarily in an appropriate microenvironment [4]. Precise localization of molecular indicators by spatial immunophenotyping techniques inside the microenvironment concedes an additional comprehensive analysis of the tumor to foresee its progression and therapy response [5,6,7].
In the past few years, in-depth profiling of cancer cells/tissues has determined the cancer genome, the transcriptome, and the proteome as powerful sources of diagnostic, prognostic, and predictive markers/biomarkers [8,9]. In this regard, spatially mapped cellular gene expression has appeared as a critical method to understand the localization and complicated multicellular interactions of DNA, RNA, and proteins within cells located in the tumor as well as in the TME [10,11]. Interrogation of the tumor cellular organization context at single cell level with the cell’s interactions with neighbor cells helps towards a better understanding of the heterogeneity of the TME between individuals as well as within the same tumor sample [12,13]. Thus, a need arises for multi-omics approaches where many DNA, RNA, splice variants and protein targets can be visualized by various staining techniques in situ. This dictates the need to quantify stained tissue sections, in terms of intensity, presence (expression levels), and/or spatial distribution in an unbiased, objective, fast, and automated way. Next-generation digital pathology is able to fulfil these requirements in research as well as in clinics. Even though the term “digital pathology” has been used for decades, its practical definition is still limited to digitizing samples. The actual analysis in digital pathology is still performed visually—by pathologists looking on a monitor rather than through a microscope’s oculars. Converting immunohistochemistry (IHC), immunofluorescence (IF), or RNA in situ hybridization (RNA ISH) stained markers within tissues sections into digitized images is a prerequisite, but for pathology to become really “digital” and automated, further processing and extraction of quantitative data, termed as image cytometry, is required. Several commercial systems are available [14] that offer specialized software solutions utilizing image cytometry, but are methodically focused on the analysis of histological sections and are thus referred to as tissue cytometry [15,16]. Due to the constant evolvement and the increasing reliability of these systems, two commercially available whole slide imagers are approved by the ‘U.S. Food and Drug Administration’ (FDA) and can be used for clinical approaches [17]. To evaluate the reliability of these next-generation digital pathology platforms in clinics in terms of prognostication and patient management, Nagpal et al. conducted a comprehensive study using prostatectomy specimens. They established a deep convolutional neural network addressing Gleason scoring, which was trained by pathologists on 912 hematoxylin and eosin (HE) stained tissue slides. Next, they compared the classification of 29 additional pathologists with the results of the deep learning-based system. As an outcome of the study, the deep learning-based Gleason classification system showed a significantly higher sensitivity and specificity than 9 out of 10 pathologists [18]. Further studies that used deep convolutional/deep learning/machine learning networks for cancer tissue classification/TME on HE cancer samples for follow-up alignment with clinicopathological parameters are those by Jiao et al. [19], Kwak et al. [20], and Bidal et al. [21] on colon cancer samples, Mittal et al. on breast cancer [22], Wang et al. on lung adenocarcinoma [23], and Diao et al. on skin cutaneous melanoma, stomach adenocarcinoma, breast cancer, lung adenocarcinoma, and lung squamous cell carcinoma [24].
All the above-mentioned studies are good examples that show that tissue cytometry may provide the methodological basis for next-generation digital pathology, which is the state-of-the-art technology to use and constitutes an enabling factor for precision medicine in clinics as well as in research. Within this review, we are going one step further by addressing the concepts of next-generation digital pathology using imaging-based tissue cytometry, in combination with multiplexing and RNA ISH technologies, as an emerging and central method within precision diagnostics, and discussing various applications.
2. Multiplexing Techniques as Useful Tools for High-Content Phenotyping
To achieve high-content phenotyping, optionally in combination with applying genetic markers for well-defined DNA loci as well as total RNA or specific mRNA measurements, the importance of multiplexing staining techniques continues to increase in research and clinics, especially for the purpose of determining the complex immune and tumor microenvironment status in patients suffering from cancer, graft versus host disease, and other pathological conditions related to immune responses [25]. In clinics the assessment of various immune cell markers as well as immune cell populations is required for prognosis, diagnosis, and selecting the therapeutic intervention strategy. Conventional IHC/IF staining techniques are restricted by the number of markers which can be detected at once within one tissue section. This problem was bypassed by staining consecutive tissue sections, with the main limitation being that high-dimensional co-expression analysis is not possible and very precious information is lost [14]. However, in recent years the ability of multiplexing, in terms of visualizing a high number of markers at one time within a sample, has evolved and thereby represents a powerful tool for investigating complex molecular/functional processes and interactions within cells as well as in the complex native tissue environment. In this section, we discuss various immunohistochemistry and immunofluorescence multiplexing techniques.
IHC-based multiplexing methods: Conventional IHC staining usually used in pathology only allows the detection of one marker per tissue section, and therefore no co-expression analysis is possible. With IHC multiplexing techniques the number of stained markers per tissue sections can be increased drastically, which leads to more detailed staining of patient tissue, especially important for clinical applications in respect to diagnostics and prognosis [26]. Previously published multiplexing methods based on IHC are “multiplexed immunohistochemical consecutive staining on single slide” (MICSSS) [27] and “Sequential Immunoperoxidase Labelling and Erasing Method” (SIMPLE) [28]. These two techniques use the chemical property alcohol solubility of the peroxidase substrate 3-amino-9-ethylcarbazole (AEC). The protocol is similar to conventional IHC but includes after image acquisition the removal of AEC with organic solvent-based destaining buffer, and the restaining with new antibodies targeting other markers of interest. Thereby, MICSSS and SIMPLE enable multiple staining rounds. As a final step, the images taken after each staining round are overlaid and sometimes even transferred into a pseudo-color IF-like image. The advantages of these two staining techniques are that they allow co-expression analysis and there are no limitations in terms of antibody species (same antibody origin species can be used for each marker), which is a limitation in conventional staining IHC techniques. However, MICSSS and SIMPLE allow only one marker at each staining round and therefore are limited in number of markers (accordingly to published data, up to 5–10 in total) and are highly time intensive [28,29].
IF-based multiplexing methods: Multiplexing methods based on immunofluorescence are much more common and comprise many advantages over IHC-based multiplexing methods. With IF multiplexing techniques, conventional immunofluorescence staining/imaging can be extended from around 6 to up to 60 markers. Published IF multiplexing techniques include “TSA Opal multiplex immunohistochemistry” (Opal mIHC, PerkinElmer, Waltham, MA, USA) [30], “in silico multiplexing workflow” [31], “tissue-based cyclic immunofluorescence” (t-Cycif), MultiOmyx (MxIF) and “multi-epitope-ligand cartography” (MELC) technology as well as DNA barcoding-based techniques such as “CO detection by InDEXing” (CODEX, Akoya Biosciences ,Marlborough, MA, USA) and GeoMx® (NanoString, Seattle, WA, USA). IF-based methods are much more effective and faster than the IHC-based methods, given that more than one marker can be stained simultaneously in each staining round [14,31,32,33,34,35]. The Opal mIHC technique is based on sequential staining rounds, and the secondary antibodies are tagged with tyramide signal amplification system (TSA)-conjugated fluorescence molecules. Heat-treated stripping of the tissues in between the staining rounds removes the primary and secondary antibodies but not the TSA-conjugated fluorescence molecules. After multiple staining rounds, the slides can be acquired. There is no limitation in the number of different antibody species but there is a restriction in the number of fluorochromes [30]. Blenman et al. established a workflow for multiplexing that includes multiple staining rounds of the tissue, whole-slide imaging with the tissue cytometer TissueFAXS PLUS (TissueGnostics, Vienna, Austria), dye inactivation by chemical bleaching after each acquisition step, as well as merging the images from all staining rounds and quantitative analysis of the stained markers/cell populations with StrataQuest software (TissueGnostics) [31]. A similar strategy is used by the t-Cycif and the MxIF techniques [32,33]. One big advantage of these chemical bleaching-based methods is that they substantially reduce autofluorescence of the tissue after each acquisition step [36]. However, chemical bleaching-based technologies are still time consuming; for a staining protocol of 30 markers, approximately 1–2 weeks are needed. One main disadvantage of the repeated chemical-based bleaching steps for fluorochrome removal after each staining/imaging round is that the preservation of cell and tissue integrity cannot be guaranteed. Lin et al. reported that after 10 staining rounds, a loss of 2–46% of the cells within various tissue types was observed [31,32,33]. Another technology used for multiplexing is MELC, which is based on fully automated and repeated rounds of multiple marker IF staining, imaging as well as chemical and photobleaching (at the excitation wavelength) of the fluorochromes on a tissue section. The main limitation of the MELC technology is that the photobleaching and imaging step can be only applied to one microscopic field of view [35]. A rather innovative and novel technology able to deal with a very high number of different target antigens is the DNA barcoding-based method CODEX. A cocktail of up to 50 unique oligo-DNA (barcodes) conjugated antibodies specific for the target markers is applied at once on the tissue section. Next, the barcodes are detected by highly specific dye-labeled reporters, which are barcode-complementary oligonucleotides labeled with fluorochromes. Multiple rounds of staining, imaging, and removing of the reporters allow high-dimensional phenotyping [34]. Similar technology is used by GeoMx® (NanoString, Seattle, WA, USA), which is also based on oligonucleotide tags (barcodes) in combination with microscopic imaging to identify a high number of markers (proteins, mRNA, miRNA, etc.) in one hybridization reaction [26]. A summary of the above-mentioned staining methods is provided in Table 1.
The enhanced number of stained markers offered by several multiplexing methods also increases the necessity of appropriate next-generation digital pathology platforms that provide fully automated acquisition of the stained tissue sections as well as computer-assisted/digital high-content phenotypic analysis and high-dimensional data mining.
3. Advanced Imaging for Digital Pathology
The first step in a tissue cytometry/next-generation digital pathology workflow includes whole slide scanning or at least acquisition of a region of interest of the stained slide. The second and even more important step comes with the subsequent computer-assisted quantitative image analysis. Next-generation digital pathology technology aims to guide the workflow away from visual observation with a standard microscope and subjective estimations, which are funneled into scoring schemes describing marker expression with “+/++/+++”, to a fully automated computerized platform for the detection and numerical quantification of stained markers in defined cell subpopulations in relation to specific histological structures. Not only are these platforms providing a fast analysis of markers, but they also seek accurate, unbiased, reproducible, and standardized results. These platforms are already well integrated and used in various fields of research [37,38]. Additionally, in 2017 the FDA approved the first next-generation digital pathology program (Philips IntelliSite; PIPS) as a clinical digital diagnostics tool in routine diagnosis [39].
Several whole slide imaging platforms (with or without image analysis software) are commercially available in various configurations (e.g., TissueGnostics, Akoya Biosciences, Leica Biosystems, Hamamatsu, Zeiss, 3DHistech, PerkinElmer, Roche, Philips). As the name already indicates, these scanners are able to acquire whole slides instead of only individual captures of fields of view, and thereby provide complete composite digitized images of slides in high resolution. The technology used is image acquisition by either tile scanning or line scanning with a follow-up stitching of the images [14,40]. Depending on the specific next-generation digital pathology platform configuration, these scanners are able to perform whole slide imaging in different imaging modes such as brightfield, widefield fluorescence, confocal, structured illumination, multiplexing, and/or multispectral. The hardware components are usually the following: microscopy stand (upright, inverted) or boxed system without a phototube, cameras (color and/or monochrome), light sources for fluorescence and/or brightfield mode, multiple filter sets for multicolor fluorescence imaging (may include single-, dual-, and/or multi-band filters), high-quality objective lenses for acquisition with different magnifications (1× to 100×), motorized slide scanning stage or high-throughput slide loading systems. Some platforms offer objective auto-oiling for high magnifications and/or provide a slide bar-code reader for higher efficiency. A powerful computer workstation and high-resolution computer monitors for the viewing of the digitized slide as well as for the potential follow-up image analysis [37,41] are mandatory. For controlling all the individual components, for digitized slide viewing and data management, the platforms also include highly functional slide imaging software [40]. In some instances, the platforms also offer or are equipped with image analysis solutions for quantitative analysis. Such quantification is not stoichiometric, and hence does not provide chemical concentration of markers, but is rather based on comparison with negative controls, which is referred to as cytometric.
The basic Theory of Scales of Measurements defines four different types of scales—nominal, ordinal, interval, and ratio [42], the first one being referred to as qualitative, and the other three being accepted as quantitative. In all three scales, systematic, observer-independent measurements of well-defined attributes of objects can be performed, resulting in numerical values that allow for comparison of the objects under investigation as well as statistical evaluation of the assigned attributes.
Most slide scanners today provide area and distance measurements in metric values, whose measurements fall into the ratio type of scales. The amount of any given molecular marker expressed in certain cells, however, is usually determined as a relational value (e.g., mean relative fluorescence or optical density in brightfield microscopy) rather than an absolute value (e.g., µmol or nanogram). Hence, such measurements belong to the interval type of scale. Such measurements do permit comparative measurements of more and less, but it is not possible to draw conclusions by building the ratio between two values. If a cell or cell population expresses a certain molecule at a mean relative fluorescence of 7000 and another cell or cell population exhibits a value of 14,000, in the scope of a cytometric measurement it is safe to state that “the second cell/population contains more of that molecule than the first” and that “the mean relative fluorescence increases from 7000 to 14,000” in a comparison of these two entities, but it cannot be concluded that the amount of molecules doubles. This is similar to our daily temperature readings in Celsius or Fahrenheit: 30 °C is not “twice as hot as 15 °C”. Cytometric measurements belong to the interval scale and are thus to be considered quantitative.
Image analysis options can provide unlimited applications depending on the platform and among others may enable basic single cell analysis, dot detection, cellular co-expression as well as subcellular co-localization analysis, meta structure detection, multiplexed high-content phenotyping, proximity measurements, structural tracing (e.g., neurites and/or axons), particle and/or single cell tracking, as well as the analysis of spatial relationships for next-generation digital pathology [41,43]. A representative example of high-dimensional data analysis and the power of these platforms is shown in Figure 1.
4. Role of Machine Learning
A big fundamental improvement step in recent years elevating the next-generation digital pathology approach is the integration of artificial intelligence (AI) algorithms for pattern recognition into the image analysis/image cytometry process [44]. Over the past few years, these AI tools have become more robust, and with only minimal user input can be applied to automatically detect objects such as nuclei and specific structures as well as for the classification of various anatomical tissue entities within an entire digitized slide [44,45].
Understanding molecular and cellular interdependencies quickly leads to complex questions, which require the elaboration of extensive algorithms and enormous amounts of computing power to get to an answer. While machine learning has been known to have great potential in this field for many decades, in the recent past it has advanced greatly in its practical use due to the availability of powerful computer technology, in particular parallel computing on multiple CPUs and/or CPU cores as well as due to new software tools, programming languages, and advanced machine learning techniques, which have made the technologies much easier to use without the requirement of advanced theoretical knowledge [44,45]. By engaging state-of-the-art technologies, computer scientists and engineers try to generate models that can provide answers to the complex problems given by nature. Machine learning’s power resides in its robustness in generating customized models designed to solve (very) specific problems. [44]. Machine learning models are generated by learning on examples consisting in observations. Current techniques of machine learning comprise supervised, unsupervised, transfer, federated, and reinforcement learning [45].
In the case of supervised machine learning, the observations are tagged to a class by a human expert, and therefore the model efficiency is strictly related to the quality of the training data set used. An optimal training data set should cover a wide enough range of variability expected in the real-world data, for example a well annotated slide. Failing to do so can increase the possibility of misclassifications. [46].
Unsupervised learning refers to a machine learning method where the algorithm learns from examples without being able to refer to predefined target values or classes (untagged/unlabeled data). The algorithm tries to identify patterns by creating an internal representation of the data and looks for density probabilities (e.g., clustering analysis). This method is suited to search for patterns which are not obvious, or are difficult to identify even for/by the human eye [47].
The transfer machine learning method is characterized by the fact that an already trained algorithm can be used to answer different, but related questions. It means an existing trained model can be adapted/tweaked to solve new tasks without the need to train a new model from scratch [48].
In the federated machine learning method, the algorithm learns from data spread/stored on multiple devices. Federated machine learning is similar to distributed learning, but the focus is on training on heterogeneous data and not on parallelization. No training data information is shared between the devices as part of the learning process [49].
Another machine learning method, enforcement learning, is based on an algorithm that needs to take optimal decisions based on the new data presented and the cumulated experience (knowledge). The learning process is continuous; each decision taken by the algorithm is labeled using a system with rewards and punishments. The aim is to solve the task by maximizing the cumulative positive feedback [50]. Precisely, the step-by-step development in machine learning aims towards a human-like learning, in the sense that humans learn from existing experience even in unrelated sectors and can transfer knowledge to new arising tasks rather than start from the basics, which is, however, still the case in machine learning.
Due to the versatile range of applications of next-generation digital pathology discussed in the following section, these platforms (with or without AI) can be seen as a crucial part of precision medicine by providing a solid and fully automated tool for the gaining of novel information on the pathology of specific diseases, identification of novel predictive and prognostic biomarkers, as well as targets for therapy [37,38,44].
5. Current Applications of Next-Generation Digital Pathology
5.1. RNA In Situ Hybridization (ISH)
In clinical settings, a routinely used method to measure RNA is real-time PCR [51]. However, this grind-and-bind technique is unable to visualize the individual cell signals in their original context, and is prone to becoming contaminated by unintended cell and tissue types and masking the different cellular subpopulations and phenotypes in the heterogenous TME [6,52]. Next-generation sequencing and single-cell sequencing technologies can detect RNA expression at the single cell level, but dissociation from their native setting deprives the data related to their spatial relationship [53]. With the latest developments in RNA ISH, multiple approaches came into play such as non-isotopic fluorescently labeled ISH (fluorescence in situ hybridization—FISH) and biotin or hapten labeled nucleic acid probes (chromogenic in situ hybridization—CISH) to gather spatial data [52,54,55,56,57]. These methods opened a new data dimension, supporting localization and quantitation of target RNA in single cells to detect precise RNA expression in specific cell types [52,58]. However, these techniques only allow a restricted number of labels to be integrated into the probes, leading to reduced sensitivity of expression for most of the genes [52]. Due to a high possibility of cross-hybridization and non-specific binding in complicated tumors, the signal-to-noise ratio is constrained, and extreme technical complication limits the performance of these methods [52,58]. In Figure 2, a representative example of the automated quantitative analysis of FISH and RNA ISH is shown.
RNAscope by Advanced Cell Diagnostics Inc., Hayward, CA (ACD) has presented the most pragmatic method that overcomes these limitations of traditional RNA ISH by a unique probe design and an advanced signal amplification system [52,59]. This technology excels due to its specificity, sensitivity, low turnaround time, and robustness in a wide range of applications across various disciplines including infectious diseases, neuroscience, cell or gene therapy, and single-cell transcriptomic profiling in cancer [52,60,61,62,63,64]. In the TME, RNAscope has prominent advantages such as spatially mapping a cell atlas [65,66], visualizing and characterizing gene signatures and generating the immune landscape, and even identification of novel cell subtypes [67,68], classifying and identifying highly heterogeneous and immunotherapeutic cell types [69,70], and identification and characterization of a gene signature of stem cells [71,72,73] and circulating tumor cells [74,75] as well as analyzing or predicting their response to drug treatments [76,77]. Compared with a one-probe RNA ISH hybridization system, the possibility of nonspecific amplification in RNAscope is considerably low since it implies a double-probe independent hybridization system and improves the sensitivity and the signal-to-noise ratio, allowing better quantification of RNA expression [52,78].
The RNAscope method allows robust detection of mRNA, long non-coding as well as microRNAs [57,79,80,81,82], and multiple gene transcripts generated by alternative splicing [83,84] simultaneously in fresh-fixed, fresh-frozen, and formalin-fixed paraffin-embedded (FFPE) clinical specimens, revealing the full potential of RNA [85]. For example, the expression of a majority of androgen receptor (AR) splice variants other than the full-length AR variant remains unclear in prostate cancer progression. RNAscope has been proposed to be a capable technique for detecting expression and localization of splice variants by designing probes specifically to target distinct splice variants. For example, AR and AR-V7 expression have been detected in FFPE prostate tumors by RNAscope where AR expression was found to be 3-fold higher in primary tumor cells compared with benign glands, while AR-V7 expression was higher in metastatic castration-resistant prostate cancer than in primary prostatic tissues [84].
Emerging new therapeutic strategies broadly target both cellular and non-cellular components of the TME more than ever, by various therapies such as immune checkpoint blockade therapy, dendritic cell vaccination, and antiangiogenic therapy [86]. Detection of RNA targets in the TME that are involved in tumor immunotherapy with the RNAscope assay can facilitate these therapies predominantly. RNAscope applications enable the determination of localization of specific immune cell types (i.e., cytotoxic lymphocytes and regulatory T cells) in the TME [87], spatial relationships between different cell types in the TME [88], and immune activation state and function of tumor-infiltrating immune cells in the TME [89,90]. For example, Monte et al., using RNAscope assay, reported that infiltrating basophils in the TME regulate tumor-promoting Th2 inflammation and reduce survival in pancreatic cancer patients [89]. Besides, this technique is an attractive strategy to determine cell type-specific expression of immune checkpoint markers [91] and differentiate activated CAR+ T cells from endogenous T cells [5]. RNAscope’s aptitude to precisely identify the cellular sources of secreted proteins (e.g., cytokines and chemokines) is a distinct benefit since although the mRNA will always localize in the cells of origin, secreted proteins tend to dilute and diffuse in the intercellular space [67,87,92]. Besides, RNAscope provides valuable information on the differentiation of paracrine and autocrine signaling, which aids in the classification of subtypes of several cancers [93]. A dual gene analysis approach with RNAscope has been utilized for simultaneous detection of CD44+ cells and PD-L1 in head and neck squamous cell carcinoma, which found that CD44+ in the TME induces expression of PD-L1, thus subsequently suppressing T cell-mediated immunity in the TME [94]. The localization and quantification of multi-RNA from several genes simultaneously by RNAscope provide greater time saving and significant results from a single feasible technique. However, rapid mRNA translation and RNA degradation in cells can affect RNAscope applications, and thus BaseScope, a subfield of RNAscope, has been recommended for short RNA targets of 50–300 nucleotides [95]. Instead of using 20 probe pairs, BaseScope utilizes short 1–6 probe pairs to target small regions of RNA more effectively. Thus BaseScope is a successful method to determine the expression and quantification of small nucleolar RNAs (snoRNAs), microRNAs, and the RNAs which have a high potential of degradation and transient expression in the TME [95].
The newest approach of RNAscope, in combination with IHC and called dual RNAscope ISH/IHC, has proven to offer an ideal platform to generate more reliable data that can be used to study gene expression signatures at the RNA and protein level with spatial and single-cell resolution in complex TME [5]. This allows correlation of both RNA and protein expression in a single slide, simultaneously validating antibody specificity [78,96,97,98]. For example, combined detection of HPV RNA by RNAscope and Cdc2 protein expression by IHC has been useful to predict the prognosis of oropharyngeal squamous cell carcinoma patients. Even more, the results conclude that the sensitivity of RNAscope was higher than that of PCR reverse dot hybridization [98]. The automated RNAscope is a significant advancement over manual RNAscope and improves the clinical advantage by allowing more samples to be analyzed in a standardized way simultaneously with less time, less inter-user variability, and less manpower in an observer-independent manner [86]. The method has proven consistent and provides reproducible results in quantifying transcript levels. Overall, the spatial resolution presented by the RNAscope method brings a novel dimension to precise localization of target RNA in single cells and allows localization and quantitation of RNA expression in specific cell types in the TME [86].
5.2. Assessment of the Tumor Immune Microenvironment
One of the most promising fields in biomarker and therapy target detection in oncology is dedicated to the exploration of the patient-specific immune contexture in situ with conventional and multiplexing IF and IHC staining techniques in combination with automated quantification [14].
One prominent approach for immune cell assessment within a particular tumor tissue, colorectal cancer (CRC), was developed by the group of Galon et al., where they successfully established a patient stratification strategy based on the detection/identification of T cell populations within the tumor core and the invasive margin named Immunoscore (ratio of the markers CD3 and CD45RO, CD3 and CD8, or CD8 and CD45RO). It is currently undergoing evaluation/implementation as a routine parameter for prognostic and predictive diagnosis in clinics for colon cancer [99,100]. To demonstrate its power the group of Pages et al. conducted a large-scale study, where his group assessed the Immunoscore by using a digital pathology method of a large patient cohort (n = 2681 CRC patients), aligned it with clinical pathological data, and thereby was able to show the power of the Immunoscore in the prognosis of survival prediction and treatment response in CRC patients [101]. In order to provide a representative (yet not complete) overview of recent applications, Table 2 shows further examples of studies using conventional and/or multiplexing IF and/or IHC staining techniques in which next-generation digital pathology was the central method for the quantification of various immune cell markers/populations in different cancer types and aligned with clinicopathological parameters.
The examples summarized in Table 2, as well as the example shown in Figure 3 from Desbois et al. [153] show the immense power of the applications of this technique utilizing next-generation digital pathology for the assessment of the immune tumor microenvironment. In order to integrate the Immunoscore or other immune cell screening strategies also into clinical research, such fully automated next-generation digital pathology platforms should be implemented into the process of quantification of the rate of infiltration of various immune cell populations/markers. Ongoing clinical studies are aiming at the integration of such platforms in combination with the staining of a set of immune-related biomarkers including main subpopulation markers and immune checkpoint markers [14].
To sum up, the need to automatically assess immune cell markers in situ, as well as analyzing spatial relationships, and thereby providing a better understanding of various immune cells populations and their interactions, is crucial for the detection of novel predictive and prognostic biomarkers as well as for clinical therapy strategy.
5.3. Detection of Blood Vessels
Neoangiogenesis and the resulting vascularization are equally required by the tumor, as in healthy tissues. In both types of tissue, normal and tumor, cell survival and proliferation depend on oxygen and nutrition supply as well as on removal of carbon dioxide and metabolic wastes. In contrast to regulated neoangiogenesis in healthy tissues, tumor angiogenesis is characterized by an uncontrolled, ineffective, often incomplete (and therefore leaky) growth of new blood vessels within the tumor tissue in order to supply the tumor mass with oxygen and nutrition [172]. However, the in situ assessment of the density of blood vessels stained by specific markers such as CD31 or CD34 was shown to correlate with the aggressiveness of the tumor in a variety of tumor types such as CRC, breast cancer, gastric cancer, and small cell and non-small cell lung cancer [173]. Furthermore, specific therapies such as neutralizing antibodies targeting anti-vascular endothelial growth factor are widely used in several cancer types [174]. However, inhibition of vessel growth has only been shown to provide limited or even no long-term improvement for cancer types including hepatocellular carcinoma and CRC [175,176]. However, the use of different non-standardized methods for detection and quantitation of blood vessel density leads to contradicting data in terms of influence on patient survival [177]. Therefore, the unbiased automated quantification of blood vessels could help to identify patient groups that would benefit from anti-angiogenic therapies.
Summarized in Table 3 are studies where next-generation digital pathology was used to detected blood vessels/blood vessel densities. Thereby we want to emphasize that the next-generation digital pathology approach is highly versatile and can be applied to various research needs and questions, not only to single cell detection or dot (RNA ISH) detection but also for the analysis of more complex structures such as blood vessels.
6. Conclusions
Within this review, we show several application fields that contribute to next-generation digital pathology, including the analysis of RNA ISH, conventional and/or multiplexed immunophenotyping, and blood vessel detection in the tumor microenvironment. Due to new staining technologies that allow a higher number of markers, one of the new challenges is high-dimensional data mining, which needs to be addressed by next-generation digital pathology platform providers. Several platforms are available on the market tackling different kinds of requests, including slide scanning, management of a large amount of data, follow-up image analysis with integrated AI modules, as well as high-dimensional data mining. Next-generation digital pathology has the potential to elevate research and clinics by providing automated, unbiased, fast, reproducible, and therefore reliable image cytometry.
The integration of data obtained by automated analyses, referring to the levels of DNA, RNA—including non-coding RNA—and proteins, will allow the development of tools for research and diagnostics within the scope of precision medicine, i.e., with a focus on the molecular mechanisms involved in disease formation in individual patients rather than averaged cohorts, in which individual yet decisive details get lost. This is the expanding area of tissue cytometry—and the era of next-generation digital pathology.
Author Contributions
Conception and design, F.M., R.C.E. and J.B.; Writing—original draft, F.M., A.F., B.B., B.L. and R.N.; Writing—review and editing, R.C.E. and J.B. All authors have read and agreed to the published version of the manuscript.
Funding
This research received no external funding.
Institutional Review Board Statement
Not applicable.
Informed Consent Statement
Not applicable.
Conflicts of Interest
Some of the authors (F.M., R.C.E., B.B., R.N. and B.L.) are employees of TissueGnostics, which is a for-profit company.
References
- World Health Organization. Available online: https://www.who.int/health-topics/cancer#tab=tab_1 (accessed on 7 January 2021).
- Macconaill, L.E.; Garraway, L.A. Clinical implications of the cancer genome. J. Clin. Oncol. 2010, 28, 5219–5228. [Google Scholar] [CrossRef]
- Whiteside, T.L. The tumor microenvironment and its role in promoting tumor growth. Oncogene 2008, 27, 5904–5912. [Google Scholar] [CrossRef] [Green Version]
- Finkin, S.; Yuan, D.; Stein, I.; Taniguchi, K.; Weber, A.; Unger, K.; Browning, J.L.; Goossens, N.; Nakagawa, S.; Gunasekaran, G.; et al. Ectopic lymphoid structures function as microniches for tumor progenitor cells in hepatocellular carcinoma. Nat. Immunol. 2015, 16, 1235–1244. [Google Scholar] [CrossRef]
- Dikshit, A.; Phatak, J.; Kernag, S.; Pimental, H.; Zong, H.; Todorov, C.; Hernandez, L.; Kim, J.; Zhang, B.; Anderson, C.; et al. Abstract 2706: Spatially resolve RNA and protein simultaneously in FFPE tumor samples by combining RNAscope in situ hybridization and immunohistochemistry assays. Cancer Res. 2020, 80, 2706. [Google Scholar] [CrossRef]
- Morley-Bunker, A.; Pearson, J.; Currie, M.J.; Morrin, H.; Whitehead, M.R.; Eglinton, T.; Walker, L.C. Assessment of intra-tumoural colorectal cancer prognostic biomarkers using RNA in situ hybridisation. Oncotarget 2019, 10, 1425–1439. [Google Scholar] [CrossRef] [Green Version]
- Hanahan, D.; Weinberg, R.A. Hallmarks of cancer: The next generation. Cell 2011, 144, 646–674. [Google Scholar] [CrossRef] [Green Version]
- Perou, C.M.; Sorlie, T.; Eisen, M.B.; van de Rijn, M.; Jeffrey, S.S.; Rees, C.A.; Pollack, J.R.; Ross, D.T.; Johnsen, H.; Akslen, L.A.; et al. Molecular portraits of human breast tumours. Nature 2000, 406, 747–752. [Google Scholar] [CrossRef]
- Zhan, F.; Huang, Y.; Colla, S.; Stewart, J.P.; Hanamura, I.; Gupta, S.; Epstein, J.; Yaccoby, S.; Sawyer, J.; Burington, B.; et al. The molecular classification of multiple myeloma. Blood 2006, 108, 2020–2028. [Google Scholar] [CrossRef] [Green Version]
- Michaelevski, I.; Chikvashvili, D.; Tsuk, S.; Singer-Lahat, D.; Kang, Y.; Linial, M.; Gaisano, H.Y.; Fili, O.; Lotan, I. Direct interaction of target SNAREs with the Kv2.1 channel. Modal regulation of channel activation and inactivation gating. J. Biol. Chem. 2003, 278, 34320–34330. [Google Scholar] [CrossRef] [Green Version]
- Waylen, L.N.; Nim, H.T.; Martelotto, L.G.; Ramialison, M. From whole-mount to single-cell spatial assessment of gene expression in 3D. Commun. Biol. 2020, 3, 602. [Google Scholar] [CrossRef]
- Voith von Voithenberg, L.; Fomitcheva Khartchenko, A.; Huber, D.; Schraml, P.; Kaigala, G.V. Spatially multiplexed RNA in situ hybridization to reveal tumor heterogeneity. Nucleic Acids Res. 2020, 48, e17. [Google Scholar] [CrossRef] [Green Version]
- Matos, L.L.; Trufelli, D.C.; de Matos, M.G.; da Silva Pinhal, M.A. Immunohistochemistry as an important tool in biomarkers detection and clinical practice. Biomark Insights 2010, 5, 9–20. [Google Scholar] [CrossRef] [Green Version]
- Shakya, R.; Nguyen, T.H.; Waterhouse, N.; Khanna, R. Immune contexture analysis in immuno-oncology: Applications and challenges of multiplex fluorescent immunohistochemistry. Clin. Transl. Immunol. 2020, 9, e1183. [Google Scholar] [CrossRef]
- Ecker, R.C.; Rogojanu, R.; Streit, M.; Oesterreicher, K.; Steiner, G.E. An improved method for discrimination of cell populations in tissue sections using microscopy-based multicolor tissue cytometry. Cytom. Part A J. Int. Soc. Anal. Cytol. 2006, 69, 119–123. [Google Scholar] [CrossRef]
- Ecker, R.C.; Steiner, G.E. Microscopy-based multicolor tissue cytometry at the single-cell level. Cytom. Part A J. Int. Soc. Anal. Cytol. 2004, 59, 182–190. [Google Scholar] [CrossRef]
- Parwani, A.V. Next generation diagnostic pathology: Use of digital pathology and artificial intelligence tools to augment a pathological diagnosis. Diagn. Pathol. 2019, 14, 138. [Google Scholar] [CrossRef]
- Nagpal, K.; Foote, D.; Liu, Y.; Chen, P.-H.C.; Wulczyn, E.; Tan, F.; Olson, N.; Smith, J.L.; Mohtashamian, A.; Wren, J.H.; et al. Development and validation of a deep learning algorithm for improving Gleason scoring of prostate cancer. NPJ Digit. Med. 2019, 2, 48. [Google Scholar] [CrossRef] [Green Version]
- Jiao, Y.; Li, J.; Qian, C.; Fei, S. Deep learning-based tumor microenvironment analysis in colon adenocarcinoma histopathological whole-slide images. Comput. Methods Programs Biomed. 2021, 204, 106047. [Google Scholar] [CrossRef]
- Kwak, M.S.; Lee, H.H.; Yang, J.M.; Cha, J.M.; Jeon, J.W.; Yoon, J.Y.; Kim, H.I. Deep Convolutional Neural Network-Based Lymph Node Metastasis Prediction for Colon Cancer Using Histopathological Images. Front. Oncol. 2021, 10, 3053. [Google Scholar] [CrossRef]
- Bilal, M.; Raza, S.E.A.; Azam, A.; Graham, S.; Ilyas, M.; Cree, I.A.; Snead, D.; Minhas, F.; Rajpoot, N.M. Novel deep learning algorithm predicts the status of molecular pathways and key mutations in colorectal cancer from routine histology images. medRxiv 2021. [Google Scholar] [CrossRef]
- Mittal, S.; Yeh, K.; Leslie, L.S.; Kenkel, S.; Kajdacsy-Balla, A.; Bhargava, R. Simultaneous cancer and tumor microenvironment subtyping using confocal infrared microscopy for all-digital molecular histopathology. Proc. Natl. Acad. Sci. USA 2018, 115, E5651–E5660. [Google Scholar] [CrossRef] [Green Version]
- Wang, S.; Rong, R.; Yang, D.M.; Fujimoto, J.; Yan, S.; Cai, L.; Yang, L.; Luo, D.; Behrens, C.; Parra, E.R.; et al. Computational Staining of Pathology Images to Study the Tumor Microenvironment in Lung Cancer. Cancer Res. 2020, 80, 2056–2066. [Google Scholar] [CrossRef] [Green Version]
- Diao, J.A.; Wang, J.K.; Chui, W.F.; Mountain, V.; Gullapally, S.C.; Srinivasan, R.; Mitchell, R.N.; Glass, B.; Hoffman, S.; Rao, S.K.; et al. Human-interpretable image features derived from densely mapped cancer pathology slides predict diverse molecular phenotypes. Nat. Commun. 2021, 12, 1613. [Google Scholar] [CrossRef]
- Dieu-Nosjean, M.C.; Goc, J.; Giraldo, N.A.; Sautès-Fridman, C.; Fridman, W.H. Tertiary lymphoid structures in cancer and beyond. Trends Immunol. 2014, 35, 571–580. [Google Scholar] [CrossRef]
- Tan, W.C.C.; Nerurkar, S.N.; Cai, H.Y.; Ng, H.H.M.; Wu, D.; Wee, Y.T.F.; Lim, J.C.T.; Yeong, J.; Lim, T.K.H. Overview of multiplex immunohistochemistry/immunofluorescence techniques in the era of cancer immunotherapy. Cancer Commun. 2020, 40, 135–153. [Google Scholar] [CrossRef] [Green Version]
- Remark, R.; Lupo, A.; Alifano, M.; Biton, J.; Ouakrim, H.; Stefani, A.; Cremer, I.; Goc, J.; Regnard, J.F.; Dieu-Nosjean, M.C.; et al. Immune contexture and histological response after neoadjuvant chemotherapy predict clinical outcome of lung cancer patients. Oncoimmunology 2016, 5, e1255394. [Google Scholar] [CrossRef] [Green Version]
- Glass, G.; Papin, J.A.; Mandell, J.W. SIMPLE: A sequential immunoperoxidase labeling and erasing method. J. Histochem. Cytochem. 2009, 57, 899–905. [Google Scholar] [CrossRef] [Green Version]
- Remark, R.; Merghoub, T.; Grabe, N.; Litjens, G.; Damotte, D.; Wolchok, J.D.; Merad, M.; Gnjatic, S. In-depth tissue profiling using multiplexed immunohistochemical consecutive staining on single slide. Sci. Immunol. 2016, 1, aaf6925. [Google Scholar] [CrossRef]
- Sun, Z.; Nyberg, R.; Wu, Y.; Bernard, B.; Redmond, W.L. Developing an enhanced 7-color multiplex IHC protocol to dissect immune infiltration in human cancers. PLoS ONE 2021, 16, e0247238. [Google Scholar] [CrossRef]
- Blenman, K.R.M.; Bosenberg, M.W. Immune Cell and Cell Cluster Phenotyping, Quantitation, and Visualization Using In Silico Multiplexed Images and Tissue Cytometry. Cytom. Part A J. Int. Soc. Anal. Cytol. 2019, 95, 399–410. [Google Scholar] [CrossRef]
- Lin, J.R.; Izar, B.; Wang, S.; Yapp, C.; Mei, S.; Shah, P.M.; Santagata, S.; Sorger, P.K. Highly multiplexed immunofluorescence imaging of human tissues and tumors using t-CyCIF and conventional optical microscopes. eLife 2018, 7. [Google Scholar] [CrossRef]
- Gerdes, M.J.; Sevinsky, C.J.; Sood, A.; Adak, S.; Bello, M.O.; Bordwell, A.; Can, A.; Corwin, A.; Dinn, S.; Filkins, R.J.; et al. Highly multiplexed single-cell analysis of formalin-fixed, paraffin-embedded cancer tissue. Proc. Natl. Acad. Sci. USA 2013, 110, 11982–11987. [Google Scholar] [CrossRef] [Green Version]
- Goltsev, Y.; Samusik, N.; Kennedy-Darling, J.; Bhate, S.; Hale, M.; Vazquez, G.; Black, S.; Nolan, G.P. Deep Profiling of Mouse Splenic Architecture with CODEX Multiplexed Imaging. Cell 2018, 174, 968–981.e915. [Google Scholar] [CrossRef] [Green Version]
- Parra, E.R.; Francisco-Cruz, A.; Wistuba, I.I. State-of-the-Art of Profiling Immune Contexture in the Era of Multiplexed Staining and Digital Analysis to Study Paraffin Tumor Tissues. Cancers 2019, 11, 247. [Google Scholar] [CrossRef] [Green Version]
- Du, Z.; Lin, J.R.; Rashid, R.; Maliga, Z.; Wang, S.; Aster, J.C.; Izar, B.; Sorger, P.K.; Santagata, S. Qualifying antibodies for image-based immune profiling and multiplexed tissue imaging. Nat. Protoc. 2019, 14, 2900–2930. [Google Scholar] [CrossRef]
- Bhargava, R.; Madabhushi, A. Emerging Themes in Image Informatics and Molecular Analysis for Digital Pathology. Annu. Rev. Biomed. Eng. 2016, 18, 387–412. [Google Scholar] [CrossRef] [Green Version]
- Ghaznavi, F.; Evans, A.; Madabhushi, A.; Feldman, M. Digital Imaging in Pathology: Whole-Slide Imaging and Beyond. Annu. Rev. Pathol. Mech. Dis. 2013, 8, 331–359. [Google Scholar] [CrossRef] [Green Version]
- Fertig, R.M.; Sangueza, O.; Gaudi, S.; Gamret, A.C.; Cervantes, J.; Jukic, D.M. Whole Slide Imaging. Am. J. Dermatopathol. 2018, 40, 938–939. [Google Scholar] [CrossRef]
- Hamilton, P.W.; Bankhead, P.; Wang, Y.; Hutchinson, R.; Kieran, D.; McArt, D.G.; James, J.; Salto-Tellez, M. Digital pathology and image analysis in tissue biomarker research. Methods 2014, 70, 59–73. [Google Scholar] [CrossRef]
- Meshcheryakova, A.; Mungenast, F.; Ecker, R.; Mechtcheriakova, D. Tissue Image Cytometry. In COMULIS IoP-IPEM Ebook/Textbook: A Compendium of Imaging Modalities for Biological and Preclinicial Research; accepted for publication.
- Stevens, S.S. On the Theory of Scales of Measurement. Science 1946, 103, 677–680. [Google Scholar] [CrossRef]
- Meshcheryakova, A.; Zimmermann, P.; Ecker, R.; Mungenast, F.; Heinze, G.; Mechtcheriakova, D. An Integrative MuSiCO Algorithm: From the Patient-Specific Transcriptional Profiles to Novel Checkpoints in Disease Pathobiology. In Systems Biology; Rajewsky, N., Jurga, S., Barciszewski, J., Eds.; Springer International Publishing: Cham, Switzerland, 2018; pp. 351–372. [Google Scholar] [CrossRef]
- Pantanowitz, L.; Sharma, A.; Carter, A.B.; Kurc, T.; Sussman, A.; Saltz, J. Twenty Years of Digital Pathology: An Overview of the Road Travelled, What is on the Horizon, and the Emergence of Vendor-Neutral Archives. J. Pathol. Inform. 2018, 9, 40. [Google Scholar] [CrossRef]
- Meijering, E. A bird’s-eye view of deep learning in bioimage analysis. Comput. Struct. Biotechnol. J. 2020, 18, 2312–2325. [Google Scholar] [CrossRef]
- Zhang, M.; Zhou, Y.; Zhao, J.; Man, Y.; Liu, B.; Yao, R. A survey of semi- and weakly supervised semantic segmentation of images. Artif. Intell. Rev. 2020, 53, 4259–4288. [Google Scholar] [CrossRef]
- Wilson, G.; Cook, D. A Survey of Unsupervised Deep Domain Adaptation. Assoc. Comput. Mach. 2020, 11. [Google Scholar] [CrossRef]
- Weiss, K.; Khoshgoftaar, T.M.; Wang, D. A survey of transfer learning. J. Big Data 2016, 3, 9. [Google Scholar] [CrossRef] [Green Version]
- Yang, Q.; Liu, Y.; Chen, T.; Tong, Y. Federated Machine Learning: Concept and Applications. ACM Trans. Intell. Syst. Technol. 2019, 10. [Google Scholar] [CrossRef]
- Wang, J.; Su, X.; Zhao, L.; Zhang, J. Deep Reinforcement Learning for Data Association in Cell Tracking. Front. Bioeng. Biotechnol. 2020, 8, 298. [Google Scholar] [CrossRef]
- Wong, M.L.; Medrano, J.F. Real-time PCR for mRNA quantitation. BioTechniques 2005, 39, 75–85. [Google Scholar] [CrossRef]
- Wang, F.; Flanagan, J.; Su, N.; Wang, L.C.; Bui, S.; Nielson, A.; Wu, X.; Vo, H.T.; Ma, X.J.; Luo, Y. RNAscope: A novel in situ RNA analysis platform for formalin-fixed, paraffin-embedded tissues. J. Mol. Diagn. JMD 2012, 14, 22–29. [Google Scholar] [CrossRef] [Green Version]
- Grün, D.; van Oudenaarden, A. Design and Analysis of Single-Cell Sequencing Experiments. Cell 2015, 163, 799–810. [Google Scholar] [CrossRef] [Green Version]
- Jin, L.; Lloyd, R.V. In situ hybridization: Methods and applications. J. Clin. Lab. Anal. 1997, 11, 2–9. [Google Scholar] [CrossRef]
- Kenny, D.; Shen, L.P.; Kolberg, J.A. Detection of viral infection and gene expression in clinical tissue specimens using branched DNA (bDNA) in situ hybridization. J. Histochem. Cytochem. 2002, 50, 1219–1227. [Google Scholar] [CrossRef]
- Thomsen, R.; Nielsen, P.S.; Jensen, T.H. Dramatically improved RNA in situ hybridization signals using LNA-modified probes. RNA 2005, 11, 1745–1748. [Google Scholar] [CrossRef] [Green Version]
- Yin, V.P. In Situ Detection of MicroRNA Expression with RNAscope Probes. Methods Mol. Biol. 2018, 1649, 197–208. [Google Scholar] [CrossRef]
- Cassidy, A.; Jones, J. Developments in in situ hybridisation. Methods 2014, 70, 39–45. [Google Scholar] [CrossRef]
- Wang, H.; Su, N.; Wang, L.C.; Wu, X.; Bui, S.; Nielsen, A.; Vo, H.T.; Luo, Y.; Ma, X.J. Dual-color ultrasensitive bright-field RNA in situ hybridization with RNAscope. Methods Mol. Biol. 2014, 1211, 139–149. [Google Scholar] [CrossRef]
- Carossino, M.; Loynachan, A.T.; James MacLachlan, N.; Drew, C.; Shuck, K.M.; Timoney, P.J.; Del Piero, F.; Balasuriya, U.B. Detection of equine arteritis virus by two chromogenic RNA in situ hybridization assays (conventional and RNAscope(®)) and assessment of their performance in tissues from aborted equine fetuses. Arch. Virol. 2016, 161, 3125–3136. [Google Scholar] [CrossRef]
- Deleage, C.; Wietgrefe, S.W.; Del Prete, G.; Morcock, D.R.; Hao, X.P.; Piatak, M., Jr.; Bess, J.; Anderson, J.L.; Perkey, K.E.; Reilly, C.; et al. Defining HIV and SIV Reservoirs in Lymphoid Tissues. Pathog. Immun. 2016, 1, 68–106. [Google Scholar] [CrossRef] [Green Version]
- Roe, C.J.; Siddiqui, M.T.; Lawson, D.; Cohen, C. RNA In Situ Hybridization for Epstein-Barr Virus and Cytomegalovirus: Comparison With In Situ Hybridization and Immunohistochemistry. Appl. Immunohistochem. Mol. Morphol. AIMM 2019, 27, 155–159. [Google Scholar] [CrossRef]
- Wang, H.; Wang, M.X.; Su, N.; Wang, L.C.; Wu, X.; Bui, S.; Nielsen, A.; Vo, H.T.; Nguyen, N.; Luo, Y.; et al. RNAscope for in situ detection of transcriptionally active human papillomavirus in head and neck squamous cell carcinoma. J. Vis. Exp. JoVE 2014. [Google Scholar] [CrossRef] [Green Version]
- Zhang, W.; Svensson Akusjärvi, S.; Sönnerborg, A.; Neogi, U. Characterization of Inducible Transcription and Translation-Competent HIV-1 Using the RNAscope ISH Technology at a Single-Cell Resolution. Front. Microbiol. 2018, 9, 2358. [Google Scholar] [CrossRef]
- Venteicher, A.S.; Tirosh, I.; Hebert, C.; Yizhak, K.; Neftel, C.; Filbin, M.G.; Hovestadt, V.; Escalante, L.E.; Shaw, M.L.; Rodman, C.; et al. Decoupling genetics, lineages, and microenvironment in IDH-mutant gliomas by single-cell RNA-seq. Science 2017, 355. [Google Scholar] [CrossRef] [Green Version]
- Zeisel, A.; Hochgerner, H.; Lönnerberg, P.; Johnsson, A.; Memic, F.; van der Zwan, J.; Häring, M.; Braun, E.; Borm, L.E.; La Manno, G.; et al. Molecular Architecture of the Mouse Nervous System. Cell 2018, 174, 999–1014.e1022. [Google Scholar] [CrossRef] [Green Version]
- Lee, J.C.; Jeng, Y.M.; Su, S.Y.; Wu, C.T.; Tsai, K.S.; Lee, C.H.; Lin, C.Y.; Carter, J.M.; Huang, J.W.; Chen, S.H.; et al. Identification of a novel FN1-FGFR1 genetic fusion as a frequent event in phosphaturic mesenchymal tumour. J. Pathol. 2015, 235, 539–545. [Google Scholar] [CrossRef]
- Wu, G.; Barnhill, R.L.; Lee, S.; Li, Y.; Shao, Y.; Easton, J.; Dalton, J.; Zhang, J.; Pappo, A.; Bahrami, A. The landscape of fusion transcripts in spitzoid melanoma and biologically indeterminate spitzoid tumors by RNA sequencing. Mod. Pathol. 2016, 29, 359–369. [Google Scholar] [CrossRef] [Green Version]
- Nasir, A.; Reising, L.O.; Nedderman, D.M.; Fulford, A.D.; Uhlik, M.T.; Benjamin, L.E.; Schade, A.E.; Holzer, T.R. Heterogeneity of Vascular Endothelial Growth Factor Receptors 1, 2, 3 in Primary Human Colorectal Carcinoma. Anticancer Res. 2016, 36, 2683–2696. [Google Scholar]
- Wang, Z.; Portier, B.P.; Gruver, A.M.; Bui, S.; Wang, H.; Su, N.; Vo, H.T.; Ma, X.J.; Luo, Y.; Budd, G.T.; et al. Automated quantitative RNA in situ hybridization for resolution of equivocal and heterogeneous ERBB2 (HER2) status in invasive breast carcinoma. J. Mol. Diagn. JMD 2013, 15, 210–219. [Google Scholar] [CrossRef]
- Barry, E.R.; Morikawa, T.; Butler, B.L.; Shrestha, K.; de la Rosa, R.; Yan, K.S.; Fuchs, C.S.; Magness, S.T.; Smits, R.; Ogino, S.; et al. Restriction of intestinal stem cell expansion and the regenerative response by YAP. Nature 2013, 493, 106–110. [Google Scholar] [CrossRef]
- Jang, B.G.; Lee, B.L.; Kim, W.H. Distribution of LGR5+ cells and associated implications during the early stage of gastric tumorigenesis. PLoS ONE 2013, 8, e82390. [Google Scholar] [CrossRef]
- Ziskin, J.L.; Dunlap, D.; Yaylaoglu, M.; Fodor, I.K.; Forrest, W.F.; Patel, R.; Ge, N.; Hutchins, G.G.; Pine, J.K.; Quirke, P.; et al. In situ validation of an intestinal stem cell signature in colorectal cancer. Gut 2013, 62, 1012–1023. [Google Scholar] [CrossRef]
- Payne, R.E.; Wang, F.; Su, N.; Krell, J.; Zebrowski, A.; Yagüe, E.; Ma, X.J.; Luo, Y.; Coombes, R.C. Viable circulating tumour cell detection using multiplex RNA in situ hybridisation predicts progression-free survival in metastatic breast cancer patients. Br. J. Cancer 2012, 106, 1790–1797. [Google Scholar] [CrossRef] [Green Version]
- Yu, M.; Bardia, A.; Wittner, B.S.; Stott, S.L.; Smas, M.E.; Ting, D.T.; Isakoff, S.J.; Ciciliano, J.C.; Wells, M.N.; Shah, A.M.; et al. Circulating breast tumor cells exhibit dynamic changes in epithelial and mesenchymal composition. Science 2013, 339, 580–584. [Google Scholar] [CrossRef] [Green Version]
- Kim, S.Y.; Theunissen, J.W.; Balibalos, J.; Liao-Chan, S.; Babcock, M.C.; Wong, T.; Cairns, B.; Gonzalez, D.; van der Horst, E.H.; Perez, M.; et al. A novel antibody-drug conjugate targeting SAIL for the treatment of hematologic malignancies. Blood Cancer J. 2015, 5, e316. [Google Scholar] [CrossRef] [Green Version]
- Naipal, K.A.; Verkaik, N.S.; Ameziane, N.; van Deurzen, C.H.; Ter Brugge, P.; Meijers, M.; Sieuwerts, A.M.; Martens, J.W.; O’Connor, M.J.; Vrieling, H.; et al. Functional ex vivo assay to select homologous recombination-deficient breast tumors for PARP inhibitor treatment. Clin. Cancer Res. 2014, 20, 4816–4826. [Google Scholar] [CrossRef] [Green Version]
- Carossino, M.; Ip, H.S.; Richt, J.A.; Shultz, K.; Harper, K.; Loynachan, A.T.; Del Piero, F.; Balasuriya, U.B.R. Detection of SARS-CoV-2 by RNAscope(®) in situ hybridization and immunohistochemistry techniques. Arch. Virol. 2020, 165, 2373–2377. [Google Scholar] [CrossRef]
- Boukerroucha, M.; Josse, C.; ElGuendi, S.; Boujemla, B.; Frères, P.; Marée, R.; Wenric, S.; Segers, K.; Collignon, J.; Jerusalem, G.; et al. Evaluation of BRCA1-related molecular features and microRNAs as prognostic factors for triple negative breast cancers. BMC Cancer 2015, 15, 755. [Google Scholar] [CrossRef] [Green Version]
- Fabbri, E.; Brognara, E.; Montagner, G.; Ghimenton, C.; Eccher, A.; Cantù, C.; Khalil, S.; Bezzerri, V.; Provezza, L.; Bianchi, N.; et al. Regulation of IL-8 gene expression in gliomas by microRNA miR-93. BMC Cancer 2015, 15, 661. [Google Scholar] [CrossRef] [Green Version]
- Lessard, L.; Liu, M.; Marzese, D.M.; Wang, H.; Chong, K.; Kawas, N.; Donovan, N.C.; Kiyohara, E.; Hsu, S.; Nelson, N.; et al. The CASC15 Long Intergenic Noncoding RNA Locus Is Involved in Melanoma Progression and Phenotype Switching. J. Investig. Dermatol. 2015, 135, 2464–2474. [Google Scholar] [CrossRef] [Green Version]
- Xing, Z.; Park, P.K.; Lin, C.; Yang, L. LncRNA BCAR4 wires up signaling transduction in breast cancer. RNA Biol. 2015, 12, 681–689. [Google Scholar] [CrossRef] [Green Version]
- Welti, J.; Rodrigues, D.N.; Sharp, A.; Sun, S.; Lorente, D.; Riisnaes, R.; Figueiredo, I.; Zafeiriou, Z.; Rescigno, P.; de Bono, J.S.; et al. Analytical Validation and Clinical Qualification of a New Immunohistochemical Assay for Androgen Receptor Splice Variant-7 Protein Expression in Metastatic Castration-resistant Prostate Cancer. Eur. Urol. 2016, 70, 599–608. [Google Scholar] [CrossRef] [Green Version]
- Guedes, L.B.; Morais, C.L.; Almutairi, F.; Haffner, M.C.; Zheng, Q.; Isaacs, J.T.; Antonarakis, E.S.; Lu, C.; Tsai, H.; Luo, J.; et al. Analytic Validation of RNA In Situ Hybridization (RISH) for AR and AR-V7 Expression in Human Prostate Cancer. Clin. Cancer Res. 2016, 22, 4651–4663. [Google Scholar] [CrossRef] [Green Version]
- Anderson, C.M.; Zhang, B.; Miller, M.; Butko, E.; Wu, X.; Laver, T.; Kernag, C.; Kim, J.; Luo, Y.; Lamparski, H.; et al. Fully Automated RNAscope In Situ Hybridization Assays for Formalin-Fixed Paraffin-Embedded Cells and Tissues. J. Cell. Biochem. 2016, 117, 2201–2208. [Google Scholar] [CrossRef] [Green Version]
- Anderson, N.M.; Simon, M.C. The tumor microenvironment. Curr. Biol. CB 2020, 30, R921–R925. [Google Scholar] [CrossRef]
- Du, Z.; Abedalthagafi, M.; Aizer, A.A.; McHenry, A.R.; Sun, H.H.; Bray, M.A.; Viramontes, O.; Machaidze, R.; Brastianos, P.K.; Reardon, D.A.; et al. Increased expression of the immune modulatory molecule PD-L1 (CD274) in anaplastic meningioma. Oncotarget 2015, 6, 4704–4716. [Google Scholar] [CrossRef] [Green Version]
- Patel, K.R.; Liu, T.C.; Vaccharajani, N.; Chapman, W.C.; Brunt, E.M. Characterization of inflammatory (lymphoepithelioma-like) hepatocellular carcinoma: A study of 8 cases. Arch. Pathol. Lab. Med. 2014, 138, 1193–1202. [Google Scholar] [CrossRef]
- De Monte, L.; Wörmann, S.; Brunetto, E.; Heltai, S.; Magliacane, G.; Reni, M.; Paganoni, A.M.; Recalde, H.; Mondino, A.; Falconi, M.; et al. Basophil Recruitment into Tumor-Draining Lymph Nodes Correlates with Th2 Inflammation and Reduced Survival in Pancreatic Cancer Patients. Cancer Res. 2016, 76, 1792–1803. [Google Scholar] [CrossRef] [Green Version]
- Ukpo, O.C.; Thorstad, W.L.; Lewis, J.S., Jr. B7-H1 expression model for immune evasion in human papillomavirus-related oropharyngeal squamous cell carcinoma. Head Neck Pathol. 2013, 7, 113–121. [Google Scholar] [CrossRef] [Green Version]
- Kim, J.; Li, N.; He, M.; Zhang, B.; Su, N.; Ma, X.-J.; Park, E. Abstract A24: Evaluation of the expression of immune functional markers in the tumor microenvironment. Cancer Immunol. Res. 2017, 5, A24. [Google Scholar] [CrossRef]
- Staudt, N.D.; Jo, M.; Hu, J.; Bristow, J.M.; Pizzo, D.P.; Gaultier, A.; VandenBerg, S.R.; Gonias, S.L. Myeloid cell receptor LRP1/CD91 regulates monocyte recruitment and angiogenesis in tumors. Cancer Res. 2013, 73, 3902–3912. [Google Scholar] [CrossRef] [Green Version]
- Shames, D.S.; Carbon, J.; Walter, K.; Jubb, A.M.; Kozlowski, C.; Januario, T.; Do, A.; Fu, L.; Xiao, Y.; Raja, R.; et al. High heregulin expression is associated with activated HER3 and may define an actionable biomarker in patients with squamous cell carcinomas of the head and neck. PLoS ONE 2013, 8, e56765. [Google Scholar] [CrossRef] [Green Version]
- Lee, Y.; Shin, J.H.; Longmire, M.; Wang, H.; Kohrt, H.E.; Chang, H.Y.; Sunwoo, J.B. CD44+ Cells in Head and Neck Squamous Cell Carcinoma Suppress T-Cell-Mediated Immunity by Selective Constitutive and Inducible Expression of PD-L1. Clin. Cancer Res. 2016, 22, 3571–3581. [Google Scholar] [CrossRef] [Green Version]
- bitesizebio.com. New-ISH on the Block: Introduction to RNAscope®. Available online: https://bitesizebio.com/40621/new-ish-on-the-block-introduction-to-rnascope (accessed on 7 January 2021).
- Annese, T.; Tamma, R.; De Giorgis, M.; Ruggieri, S.; Maiorano, E.; Specchia, G.; Ribatti, D. RNAscope dual ISH-IHC technology to study angiogenesis in diffuse large B-cell lymphomas. Histochem. Cell Biol. 2020, 153, 185–192. [Google Scholar] [CrossRef]
- Chan, S.; Filézac de L’Etang, A.; Rangell, L.; Caplazi, P.; Lowe, J.B.; Romeo, V. A method for manual and automated multiplex RNAscope in situ hybridization and immunocytochemistry on cytospin samples. PLoS ONE 2018, 13, e0207619. [Google Scholar] [CrossRef] [Green Version]
- Yang, J.Q.; Wu, M.; Han, F.Y.; Sun, Y.M.; Zhang, L.; Liu, H.X. High risk HPV detection by RNAscope in situ hybridization combined with Cdc2 protein expression by immunohistochemistry for prognosis of oropharyngeal squamous cell carcinoma. Int. J. Clin. Exp. Pathol. 2020, 13, 2192–2200. [Google Scholar]
- Angell, H.K.; Gray, N.; Womack, C.; Pritchard, D.I.; Wilkinson, R.W.; Cumberbatch, M. Digital pattern recognition-based image analysis quantifies immune infiltrates in distinct tissue regions of colorectal cancer and identifies a metastatic phenotype. Br. J. Cancer 2013, 109, 1618–1624. [Google Scholar] [CrossRef] [Green Version]
- Bindea, G.; Mlecnik, B.; Fridman, W.-H.; Galon, J. The prognostic impact of anti-cancer immune response: A novel classification of cancer patients. Semin. Immunopathol. 2011, 33, 335–340. [Google Scholar] [CrossRef] [Green Version]
- Pagès, F.; Mlecnik, B.; Marliot, F.; Bindea, G.; Ou, F.S.; Bifulco, C.; Lugli, A.; Zlobec, I.; Rau, T.T.; Berger, M.D.; et al. International validation of the consensus Immunoscore for the classification of colon cancer: A prognostic and accuracy study. Lancet 2018, 391, 2128–2139. [Google Scholar] [CrossRef]
- Seo, A.N.; Lee, H.J.; Kim, E.J.; Kim, H.J.; Jang, M.H.; Lee, H.E.; Kim, Y.J.; Kim, J.H.; Park, S.Y. Tumour-infiltrating CD8+ lymphocytes as an independent predictive factor for pathological complete response to primary systemic therapy in breast cancer. Br. J. Cancer 2013, 109, 2705–2713. [Google Scholar] [CrossRef] [Green Version]
- García-Martínez, E.; Gil, G.L.; Benito, A.C.; González-Billalabeitia, E.; Conesa, M.A.; García García, T.; García-Garre, E.; Vicente, V.; Ayala de la Peña, F. Tumor-infiltrating immune cell profiles and their change after neoadjuvant chemotherapy predict response and prognosis of breast cancer. Breast Cancer Res. BCR 2014, 16, 488. [Google Scholar] [CrossRef] [Green Version]
- Humphries, M.P.; Hynes, S.; Bingham, V.; Cougot, D.; James, J.; Patel-Socha, F.; Parkes, E.E.; Blayney, J.K.; O’Rorke, M.A.; Irwin, G.W.; et al. Automated Tumour Recognition and Digital Pathology Scoring Unravels New Role for PD-L1 in Predicting Good Outcome in ER-/HER2+ Breast Cancer. J. Oncol. 2018, 2018, 2937012. [Google Scholar] [CrossRef]
- Rasmusson, A.; Zilenaite, D.; Nestarenkaite, A.; Augulis, R.; Laurinaviciene, A.; Ostapenko, V.; Poskus, T.; Laurinavicius, A. Immunogradient Indicators for Antitumor Response Assessment by Automated Tumor-Stroma Interface Zone Detection. Am. J. Pathol. 2020, 190, 1309–1322. [Google Scholar] [CrossRef]
- Martinet, L.; Filleron, T.; Le Guellec, S.; Rochaix, P.; Garrido, I.; Girard, J.P. High endothelial venule blood vessels for tumor-infiltrating lymphocytes are associated with lymphotoxin β-producing dendritic cells in human breast cancer. J. Immunol. 2013, 191, 2001–2008. [Google Scholar] [CrossRef]
- Martinet, L.; Garrido, I.; Filleron, T.; Le Guellec, S.; Bellard, E.; Fournie, J.J.; Rochaix, P.; Girard, J.P. Human solid tumors contain high endothelial venules: Association with T- and B-lymphocyte infiltration and favorable prognosis in breast cancer. Cancer Res. 2011, 71, 5678–5687. [Google Scholar] [CrossRef] [Green Version]
- Sobral-Leite, M.; Van de Vijver, K.; Michaut, M.; van der Linden, R.; Hooijer, G.K.J.; Horlings, H.M.; Severson, T.M.; Mulligan, A.M.; Weerasooriya, N.; Sanders, J.; et al. Assessment of PD-L1 expression across breast cancer molecular subtypes, in relation to mutation rate, BRCA1-like status, tumor-infiltrating immune cells and survival. Oncoimmunology 2018, 7, e1509820. [Google Scholar] [CrossRef] [Green Version]
- He, T.F.; Yost, S.E.; Frankel, P.H.; Dagis, A.; Cao, Y.; Wang, R.; Rosario, A.; Tu, T.Y.; Solomon, S.; Schmolze, D.; et al. Multi-panel immunofluorescence analysis of tumor infiltrating lymphocytes in triple negative breast cancer: Evolution of tumor immune profiles and patient prognosis. PLoS ONE 2020, 15, e0229955. [Google Scholar] [CrossRef] [Green Version]
- Yoon, H.H.; Shi, Q.; Heying, E.N.; Muranyi, A.; Bredno, J.; Ough, F.; Djalilvand, A.; Clements, J.; Bowermaster, R.; Liu, W.W.; et al. Intertumoral Heterogeneity of CD3(+) and CD8(+) T-Cell Densities in the Microenvironment of DNA Mismatch-Repair-Deficient Colon Cancers: Implications for Prognosis. Clin. Cancer Res. 2019, 25, 125–133. [Google Scholar] [CrossRef] [Green Version]
- Nearchou, I.P.; Lillard, K.; Gavriel, C.G.; Ueno, H.; Harrison, D.J.; Caie, P.D. Automated Analysis of Lymphocytic Infiltration, Tumor Budding, and Their Spatial Relationship Improves Prognostic Accuracy in Colorectal Cancer. Cancer Immunol. Res. 2019, 7, 609–620. [Google Scholar] [CrossRef] [Green Version]
- Chen, Y.; Yuan, R.; Wu, X.; He, X.; Zeng, Y.; Fan, X.; Wang, L.; Wang, J.; Lan, P.; Wu, X. A Novel Immune Marker Model Predicts Oncological Outcomes of Patients with Colorectal Cancer. Ann. Surg. Oncol. 2016, 23, 826–832. [Google Scholar] [CrossRef]
- Edin, S.; Kaprio, T.; Hagström, J.; Larsson, P.; Mustonen, H.; Böckelman, C.; Strigård, K.; Gunnarsson, U.; Haglund, C.; Palmqvist, R. The Prognostic Importance of CD20(+) B lymphocytes in Colorectal Cancer and the Relation to Other Immune Cell subsets. Sci. Rep. 2019, 9, 19997. [Google Scholar] [CrossRef]
- Miller, T.J.; McCoy, M.J.; Hemmings, C.; Bulsara, M.K.; Iacopetta, B.; Platell, C.F. The prognostic value of cancer stem-like cell markers SOX2 and CD133 in stage III colon cancer is modified by expression of the immune-related markers FoxP3, PD-L1 and CD3. Pathology 2017, 49, 721–730. [Google Scholar] [CrossRef]
- Miller, T.J.; Anyaegbu, C.C.; Lee-Pullen, T.F.; Spalding, L.J.; Platell, C.F.; McCoy, M.J. PD-L1+ dendritic cells in the tumor microenvironment correlate with good prognosis and CD8+ T cell infiltration in colon cancer. Cancer Sci. 2020. [Google Scholar] [CrossRef]
- Herrera, M.; Mezheyeuski, A.; Villabona, L.; Corvigno, S.; Strell, C.; Klein, C.; Hölzlwimmer, G.; Glimelius, B.; Masucci, G.; Sjöblom, T.; et al. Prognostic Interactions between FAP+ Fibroblasts and CD8a+ T Cells in Colon Cancer. Cancers 2020, 12, 3238. [Google Scholar] [CrossRef]
- Mungenast, F.; Meshcheryakova, A.; Beer, A.; Salzmann, M.; Tamandl, D.; Gruenberger, T.; Pietschmann, P.; Koperek, O.; Birner, P.; Kirsch, I.; et al. The Immune Phenotype of Isolated Lymphoid Structures in Non-Tumorous Colon Mucosa Encrypts the Information on Pathobiology of Metastatic Colorectal Cancer. Cancers 2020, 12, 3117. [Google Scholar] [CrossRef]
- Meshcheryakova, A.; Tamandl, D.; Bajna, E.; Stift, J.; Mittlboeck, M.; Svoboda, M.; Heiden, D.; Stremitzer, S.; Jensen-Jarolim, E.; Grünberger, T.; et al. B cells and ectopic follicular structures: Novel players in anti-tumor programming with prognostic power for patients with metastatic colorectal cancer. PLoS ONE 2014, 9, e99008. [Google Scholar] [CrossRef]
- Tanis, E.; Julié, C.; Emile, J.F.; Mauer, M.; Nordlinger, B.; Aust, D.; Roth, A.; Lutz, M.P.; Gruenberger, T.; Wrba, F.; et al. Prognostic impact of immune response in resectable colorectal liver metastases treated by surgery alone or surgery with perioperative FOLFOX in the randomised EORTC study 40983. Eur. J. Cancer 2015, 51, 2708–2717. [Google Scholar] [CrossRef]
- Mlecnik, B.; Van den Eynde, M.; Bindea, G.; Church, S.E.; Vasaturo, A.; Fredriksen, T.; Lafontaine, L.; Haicheur, N.; Marliot, F.; Debetancourt, D.; et al. Comprehensive Intrametastatic Immune Quantification and Major Impact of Immunoscore on Survival. J. Natl. Cancer Inst. 2018, 110, 97–108. [Google Scholar] [CrossRef] [Green Version]
- Ma, J.; Li, J.; Qian, M.; Han, W.; Tian, M.; Li, Z.; Wang, Z.; He, S.; Wu, K. PD-L1 expression and the prognostic significance in gastric cancer: A retrospective comparison of three PD-L1 antibody clones (SP142, 28–8 and E1L3N). Diagn. Pathol. 2018, 13, 91. [Google Scholar] [CrossRef]
- Kim, J.W.; Nam, K.H.; Ahn, S.H.; Park, D.J.; Kim, H.H.; Kim, S.H.; Chang, H.; Lee, J.O.; Kim, Y.J.; Lee, H.S.; et al. Prognostic implications of immunosuppressive protein expression in tumors as well as immune cell infiltration within the tumor microenvironment in gastric cancer. Gastric Cancer 2016, 19, 42–52. [Google Scholar] [CrossRef] [Green Version]
- Kim, K.J.; Lee, K.S.; Cho, H.J.; Kim, Y.H.; Yang, H.K.; Kim, W.H.; Kang, G.H. Prognostic implications of tumor-infiltrating FoxP3+ regulatory T cells and CD8+ cytotoxic T cells in microsatellite-unstable gastric cancers. Hum. Pathol. 2014, 45, 285–293. [Google Scholar] [CrossRef]
- Koh, J.; Ock, C.Y.; Kim, J.W.; Nam, S.K.; Kwak, Y.; Yun, S.; Ahn, S.H.; Park, D.J.; Kim, H.H.; Kim, W.H.; et al. Clinicopathologic implications of immune classification by PD-L1 expression and CD8-positive tumor-infiltrating lymphocytes in stage II and III gastric cancer patients. Oncotarget 2017, 8, 26356–26367. [Google Scholar] [CrossRef] [Green Version]
- Wang, M.; Huang, Y.K.; Kong, J.C.; Sun, Y.; Tantalo, D.G.; Yeang, H.X.A.; Ying, L.; Yan, F.; Xu, D.; Halse, H.; et al. High-dimensional analyses reveal a distinct role of T-cell subsets in the immune microenvironment of gastric cancer. Clin. Transl. Immunol. 2020, 9, e1127. [Google Scholar] [CrossRef]
- Svensson, M.C.; Warfvinge, C.F.; Fristedt, R.; Hedner, C.; Borg, D.; Eberhard, J.; Micke, P.; Nodin, B.; Leandersson, K.; Jirström, K. The integrative clinical impact of tumor-infiltrating T lymphocytes and NK cells in relation to B lymphocyte and plasma cell density in esophageal and gastric adenocarcinoma. Oncotarget 2017, 8, 72108–72126. [Google Scholar] [CrossRef] [Green Version]
- Kim, H.-N.; Jang, J.; Heo, Y.J.; Kim, B.; Jung, H.; Jang, Y.; Kang, S.Y.; Kim, S.T.; Lee, J.; Kang, W.K.; et al. PD-L1 expression in gastric cancer determined by digital image analyses: Pitfalls and correlation with pathologist interpretation. Virchows Arch. 2020, 476, 243–250. [Google Scholar] [CrossRef]
- Sun, C.; Xu, J.; Song, J.; Liu, C.; Wang, J.; Weng, C.; Sun, H.; Wei, H.; Xiao, W.; Sun, R.; et al. The predictive value of centre tumour CD8⁺ T cells in patients with hepatocellular carcinoma: Comparison with Immunoscore. Oncotarget 2015, 6, 35602–35615. [Google Scholar] [CrossRef] [Green Version]
- Gabrielson, A.; Wu, Y.; Wang, H.; Jiang, J.; Kallakury, B.; Gatalica, Z.; Reddy, S.; Kleiner, D.; Fishbein, T.; Johnson, L.; et al. Intratumoral CD3 and CD8 T-cell Densities Associated with Relapse-Free Survival in HCC. Cancer Immunol. Res. 2016, 4, 419–430. [Google Scholar] [CrossRef] [Green Version]
- Ma, J.; Zheng, B.; Goswami, S.; Meng, L.; Zhang, D.; Cao, C.; Li, T.; Zhu, F.; Ma, L.; Zhang, Z.; et al. PD1(Hi) CD8(+) T cells correlate with exhausted signature and poor clinical outcome in hepatocellular carcinoma. J. Immunother. Cancer 2019, 7, 331. [Google Scholar] [CrossRef]
- Garnelo, M.; Tan, A.; Her, Z.; Yeong, J.; Lim, C.J.; Chen, J.; Lim, K.H.; Weber, A.; Chow, P.; Chung, A.; et al. Interaction between tumour-infiltrating B cells and T cells controls the progression of hepatocellular carcinoma. Gut 2017, 66, 342–351. [Google Scholar] [CrossRef] [Green Version]
- Yao, Q.; Bao, X.; Xue, R.; Liu, H.; Liu, H.; Li, J.; Dong, J.; Duan, Z.; Ren, M.; Zhao, J.; et al. Prognostic value of immunoscore to identify mortality outcomes in adults with HBV-related primary hepatocellular carcinoma. Medicine 2017, 96, e6735. [Google Scholar] [CrossRef]
- Huang, Y.; Wang, F.M.; Wang, T.; Wang, Y.J.; Zhu, Z.Y.; Gao, Y.T.; Du, Z. Tumor-infiltrating FoxP3+ Tregs and CD8+ T cells affect the prognosis of hepatocellular carcinoma patients. Digestion 2012, 86, 329–337. [Google Scholar] [CrossRef]
- Amin, D.; Richa, T.; Mollaee, M.; Zhan, T.; Tassone, P.; Johnson, J.; Luginbuhl, A.; Cognetti, D.; Martinez-Outschoorn, U.; Stapp, R.; et al. Metformin Effects on FOXP3(+) and CD8(+) T Cell Infiltrates of Head and Neck Squamous Cell Carcinoma. Laryngoscope 2020, 130, E490–E498. [Google Scholar] [CrossRef]
- Zhang, X.M.; Song, L.J.; Shen, J.; Yue, H.; Han, Y.Q.; Yang, C.L.; Liu, S.Y.; Deng, J.W.; Jiang, Y.; Fu, G.H.; et al. Prognostic and predictive values of immune infiltrate in patients with head and neck squamous cell carcinoma. Hum. Pathol. 2018, 82, 104–112. [Google Scholar] [CrossRef]
- Koelzer, V.H.; Gisler, A.; Hanhart, J.C.; Griss, J.; Wagner, S.N.; Willi, N.; Cathomas, G.; Sachs, M.; Kempf, W.; Thommen, D.S.; et al. Digital image analysis improves precision of PD-L1 scoring in cutaneous melanoma. Histopathology 2018, 73, 397–406. [Google Scholar] [CrossRef]
- Garg, K.; Maurer, M.; Griss, J.; Brüggen, M.C.; Wolf, I.H.; Wagner, C.; Willi, N.; Mertz, K.D.; Wagner, S.N. Tumor-associated B cells in cutaneous primary melanoma and improved clinical outcome. Hum. Pathol. 2016, 54, 157–164. [Google Scholar] [CrossRef]
- Gartrell, R.D.; Marks, D.K.; Hart, T.D.; Li, G.; Davari, D.R.; Wu, A.; Blake, Z.; Lu, Y.; Askin, K.N.; Monod, A.; et al. Quantitative Analysis of Immune Infiltrates in Primary Melanoma. Cancer Immunol. Res. 2018, 6, 481–493. [Google Scholar] [CrossRef] [Green Version]
- Griss, J.; Bauer, W.; Wagner, C.; Simon, M.; Chen, M.; Grabmeier-Pfistershammer, K.; Maurer-Granofszky, M.; Roka, F.; Penz, T.; Bock, C.; et al. B cells sustain inflammation and predict response to immune checkpoint blockade in human melanoma. Nat. Commun. 2019, 10, 4186. [Google Scholar] [CrossRef] [Green Version]
- Thommen, D.S.; Koelzer, V.H.; Herzig, P.; Roller, A.; Trefny, M.; Dimeloe, S.; Kiialainen, A.; Hanhart, J.; Schill, C.; Hess, C.; et al. A transcriptionally and functionally distinct PD-1+ CD8+ T cell pool with predictive potential in non-small-cell lung cancer treated with PD-1 blockade. Nat. Med. 2018, 24, 994–1004. [Google Scholar] [CrossRef] [Green Version]
- Goc, J.; Germain, C.; Vo-Bourgais, T.K.; Lupo, A.; Klein, C.; Knockaert, S.; de Chaisemartin, L.; Ouakrim, H.; Becht, E.; Alifano, M.; et al. Dendritic cells in tumor-associated tertiary lymphoid structures signal a Th1 cytotoxic immune contexture and license the positive prognostic value of infiltrating CD8+ T cells. Cancer Res. 2014, 74, 705–715. [Google Scholar] [CrossRef] [Green Version]
- Sepesi, B.; Cuentas, E.P.; Canales, J.R.; Behrens, C.; Correa, A.M.; Vaporciyan, A.; Weissferdt, A.; Kalhor, N.; Moran, C.; Swisher, S.; et al. Programmed Death Cell Ligand 1 (PD-L1) Is Associated With Survival in Stage I Non-Small Cell Lung Cancer. Semin. Thorac. Cardiovasc. Surg. 2017, 29, 408–415. [Google Scholar] [CrossRef]
- Kinoshita, T.; Kudo-Saito, C.; Muramatsu, R.; Fujita, T.; Saito, M.; Nagumo, H.; Sakurai, T.; Noji, S.; Takahata, E.; Yaguchi, T.; et al. Determination of poor prognostic immune features of tumour microenvironment in non-smoking patients with lung adenocarcinoma. Eur. J. Cancer 2017, 86, 15–27. [Google Scholar] [CrossRef]
- Parra, E.R.; Behrens, C.; Rodriguez-Canales, J.; Lin, H.; Mino, B.; Blando, J.; Zhang, J.; Gibbons, D.L.; Heymach, J.V.; Sepesi, B.; et al. Image Analysis-based Assessment of PD-L1 and Tumor-Associated Immune Cells Density Supports Distinct Intratumoral Microenvironment Groups in Non-small Cell Lung Carcinoma Patients. Clin. Cancer Res. 2016, 22, 6278–6289. [Google Scholar] [CrossRef] [Green Version]
- Kinoshita, T.; Muramatsu, R.; Fujita, T.; Nagumo, H.; Sakurai, T.; Noji, S.; Takahata, E.; Yaguchi, T.; Tsukamoto, N.; Kudo-Saito, C.; et al. Prognostic value of tumor-infiltrating lymphocytes differs depending on histological type and smoking habit in completely resected non-small-cell lung cancer. Ann. Oncol. 2016, 27, 2117–2123. [Google Scholar] [CrossRef]
- Cao, L.; Che, X.; Qiu, X.; Li, Z.; Yang, B.; Wang, S.; Hou, K.; Fan, Y.; Qu, X.; Liu, Y. M2 macrophage infiltration into tumor islets leads to poor prognosis in non-small-cell lung cancer. Cancer Manag. Res. 2019, 11, 6125–6138. [Google Scholar] [CrossRef] [Green Version]
- Barua, S.; Fang, P.; Sharma, A.; Fujimoto, J.; Wistuba, I.; Rao, A.U.K.; Lin, S.H. Spatial interaction of tumor cells and regulatory T cells correlates with survival in non-small cell lung cancer. Lung Cancer 2018, 117, 73–79. [Google Scholar] [CrossRef]
- O’Callaghan, D.S.; Rexhepaj, E.; Gately, K.; Coate, L.; Delaney, D.; O’Donnell, D.M.; Kay, E.; O’Connell, F.; Gallagher, W.M.; O’Byrne, K.J. Tumour islet Foxp3+ T-cell infiltration predicts poor outcome in nonsmall cell lung cancer. Eur. Respir. J. 2015, 46, 1762–1772. [Google Scholar] [CrossRef] [Green Version]
- Althammer, S.; Tan, T.H.; Spitzmüller, A.; Rognoni, L.; Wiestler, T.; Herz, T.; Widmaier, M.; Rebelatto, M.C.; Kaplon, H.; Damotte, D.; et al. Automated image analysis of NSCLC biopsies to predict response to anti-PD-L1 therapy. J. Immunother. Cancer 2019, 7, 121. [Google Scholar] [CrossRef] [Green Version]
- Kim, M.Y.; Koh, J.; Kim, S.; Go, H.; Jeon, Y.K.; Chung, D.H. Clinicopathological analysis of PD-L1 and PD-L2 expression in pulmonary squamous cell carcinoma: Comparison with tumor-infiltrating T cells and the status of oncogenic drivers. Lung Cancer 2015, 88, 24–33. [Google Scholar] [CrossRef]
- Siliņa, K.; Soltermann, A.; Attar, F.M.; Casanova, R.; Uckeley, Z.M.; Thut, H.; Wandres, M.; Isajevs, S.; Cheng, P.; Curioni-Fontecedro, A.; et al. Germinal Centers Determine the Prognostic Relevance of Tertiary Lymphoid Structures and Are Impaired by Corticosteroids in Lung Squamous Cell Carcinoma. Cancer Res. 2018, 78, 1308–1320. [Google Scholar] [CrossRef] [Green Version]
- Feng, Z.; Bethmann, D.; Kappler, M.; Ballesteros-Merino, C.; Eckert, A.; Bell, R.B.; Cheng, A.; Bui, T.; Leidner, R.; Urba, W.J.; et al. Multiparametric immune profiling in HPV- oral squamous cell cancer. JCI Insight 2017, 2. [Google Scholar] [CrossRef]
- Desbois, M.; Udyavar, A.R.; Ryner, L.; Kozlowski, C.; Guan, Y.; Dürrbaum, M.; Lu, S.; Fortin, J.P.; Koeppen, H.; Ziai, J.; et al. Integrated digital pathology and transcriptome analysis identifies molecular mediators of T-cell exclusion in ovarian cancer. Nat. Commun. 2020, 11, 5583. [Google Scholar] [CrossRef]
- Bachmayr-Heyda, A.; Aust, S.; Heinze, G.; Polterauer, S.; Grimm, C.; Braicu, E.I.; Sehouli, J.; Lambrechts, S.; Vergote, I.; Mahner, S.; et al. Prognostic impact of tumor infiltrating CD8+ T cells in association with cell proliferation in ovarian cancer patients--a study of the OVCAD consortium. BMC Cancer 2013, 13, 422. [Google Scholar] [CrossRef] [Green Version]
- Montfort, A.; Owen, S.; Piskorz, A.M.; Supernat, A.; Moore, L.; Al-Khalidi, S.; Böhm, S.; Pharoah, P.; McDermott, J.; Balkwill, F.R.; et al. Combining measures of immune infiltration shows additive effect on survival prediction in high-grade serous ovarian carcinoma. Br. J. Cancer 2020, 122, 1803–1810. [Google Scholar] [CrossRef] [Green Version]
- Kroeger, D.R.; Milne, K.; Nelson, B.H. Tumor-Infiltrating Plasma Cells Are Associated with Tertiary Lymphoid Structures, Cytolytic T-Cell Responses, and Superior Prognosis in Ovarian Cancer. Clin. Cancer Res. 2016, 22, 3005–3015. [Google Scholar] [CrossRef] [Green Version]
- Webb, J.R.; Milne, K.; Kroeger, D.R.; Nelson, B.H. PD-L1 expression is associated with tumor-infiltrating T cells and favorable prognosis in high-grade serous ovarian cancer. Gynecol. Oncol. 2016, 141, 293–302. [Google Scholar] [CrossRef] [Green Version]
- Komdeur, F.L.; Wouters, M.C.; Workel, H.H.; Tijans, A.M.; Terwindt, A.L.; Brunekreeft, K.L.; Plat, A.; Klip, H.G.; Eggink, F.A.; Leffers, N.; et al. CD103+ intraepithelial T cells in high-grade serous ovarian cancer are phenotypically diverse TCRαβ+ CD8αβ+ T cells that can be targeted for cancer immunotherapy. Oncotarget 2016, 7, 75130–75144. [Google Scholar] [CrossRef] [Green Version]
- Stanske, M.; Wienert, S.; Castillo-Tong, D.C.; Kreuzinger, C.; Vergote, I.; Lambrechts, S.; Gabra, H.; Gourley, C.; Ganapathi, R.N.; Kolaschinski, I.; et al. Dynamics of the Intratumoral Immune Response during Progression of High-Grade Serous Ovarian Cancer. Neoplasia 2018, 20, 280–288. [Google Scholar] [CrossRef]
- Carstens, J.L.; Correa de Sampaio, P.; Yang, D.; Barua, S.; Wang, H.; Rao, A.; Allison, J.P.; LeBleu, V.S.; Kalluri, R. Spatial computation of intratumoral T cells correlates with survival of patients with pancreatic cancer. Nat. Commun. 2017, 8, 15095. [Google Scholar] [CrossRef]
- Balachandran, V.P.; Łuksza, M.; Zhao, J.N.; Makarov, V.; Moral, J.A.; Remark, R.; Herbst, B.; Askan, G.; Bhanot, U.; Senbabaoglu, Y.; et al. Identification of unique neoantigen qualities in long-term survivors of pancreatic cancer. Nature 2017, 551, 512–516. [Google Scholar] [CrossRef]
- Castino, G.F.; Cortese, N.; Capretti, G.; Serio, S.; Di Caro, G.; Mineri, R.; Magrini, E.; Grizzi, F.; Cappello, P.; Novelli, F.; et al. Spatial distribution of B cells predicts prognosis in human pancreatic adenocarcinoma. Oncoimmunology 2016, 5, e1085147. [Google Scholar] [CrossRef] [Green Version]
- Danilova, L.; Ho, W.J.; Zhu, Q.; Vithayathil, T.; De Jesus-Acosta, A.; Azad, N.S.; Laheru, D.A.; Fertig, E.J.; Anders, R.; Jaffee, E.M.; et al. Programmed Cell Death Ligand-1 (PD-L1) and CD8 Expression Profiling Identify an Immunologic Subtype of Pancreatic Ductal Adenocarcinomas with Favorable Survival. Cancer Immunol. Res. 2019, 7, 886–895. [Google Scholar] [CrossRef]
- Hou, Y.C.; Chao, Y.J.; Hsieh, M.H.; Tung, H.L.; Wang, H.C.; Shan, Y.S. Low CD8⁺ T Cell Infiltration and High PD-L1 Expression Are Associated with Level of CD44⁺/CD133⁺ Cancer Stem Cells and Predict an Unfavorable Prognosis in Pancreatic Cancer. Cancers 2019, 11, 541. [Google Scholar] [CrossRef] [Green Version]
- Ino, Y.; Oguro, S.; Yamazaki-Itoh, R.; Hori, S.; Shimada, K.; Hiraoka, N. Reliable evaluation of tumor-infiltrating lymphocytes in pancreatic cancer tissue biopsies. Oncotarget 2019, 10, 1149–1159. [Google Scholar] [CrossRef]
- Miksch, R.C.; Schoenberg, M.B.; Weniger, M.; Bösch, F.; Ormanns, S.; Mayer, B.; Werner, J.; Bazhin, A.V.; D’Haese, J.G. Prognostic Impact of Tumor-Infiltrating Lymphocytes and Neutrophils on Survival of Patients with Upfront Resection of Pancreatic Cancer. Cancers 2019, 11, 39. [Google Scholar] [CrossRef] [Green Version]
- Tahkola, K.; Leppänen, J.; Ahtiainen, M.; Väyrynen, J.; Haapasaari, K.M.; Karttunen, T.; Kellokumpu, I.; Helminen, O.; Böhm, J. Immune cell score in pancreatic cancer-comparison of hotspot and whole-section techniques. Virchows Arch. 2019, 474, 691–699. [Google Scholar] [CrossRef] [Green Version]
- Gannon, P.O.; Poisson, A.O.; Delvoye, N.; Lapointe, R.; Mes-Masson, A.M.; Saad, F. Characterization of the intra-prostatic immune cell infiltration in androgen-deprived prostate cancer patients. J. Immunol. Methods 2009, 348, 9–17. [Google Scholar] [CrossRef]
- Woo, J.R.; Liss, M.A.; Muldong, M.T.; Palazzi, K.; Strasner, A.; Ammirante, M.; Varki, N.; Shabaik, A.; Howell, S.; Kane, C.J.; et al. Tumor infiltrating B-cells are increased in prostate cancer tissue. J. Transl. Med. 2014, 12, 30. [Google Scholar] [CrossRef] [Green Version]
- Kaur, H.B.; Guedes, L.B.; Lu, J.; Maldonado, L.; Reitz, L.; Barber, J.R.; De Marzo, A.M.; Tosoian, J.J.; Tomlins, S.A.; Schaeffer, E.M.; et al. Association of tumor-infiltrating T-cell density with molecular subtype, racial ancestry and clinical outcomes in prostate cancer. Mod. Pathol. 2018, 31, 1539–1552. [Google Scholar] [CrossRef]
- Giraldo, N.A.; Becht, E.; Pagès, F.; Skliris, G.; Verkarre, V.; Vano, Y.; Mejean, A.; Saint-Aubert, N.; Lacroix, L.; Natario, I.; et al. Orchestration and Prognostic Significance of Immune Checkpoints in the Microenvironment of Primary and Metastatic Renal Cell Cancer. Clin. Cancer Res. 2015, 21, 3031–3040. [Google Scholar] [CrossRef] [Green Version]
- Wang, M.; Zhao, J.; Zhang, L.; Wei, F.; Lian, Y.; Wu, Y.; Gong, Z.; Zhang, S.; Zhou, J.; Cao, K.; et al. Role of tumor microenvironment in tumorigenesis. J. Cancer 2017, 8, 761–773. [Google Scholar] [CrossRef]
- Winter, J.; Kneitz, H.; Bröcker, E.B. Blood vessel density in Basal cell carcinomas and benign trichogenic tumors as a marker for differential diagnosis in dermatopathology. J. Skin Cancer 2011, 2011, 241382. [Google Scholar] [CrossRef] [Green Version]
- Jain, R.K. Antiangiogenesis strategies revisited: From starving tumors to alleviating hypoxia. Cancer Cell 2014, 26, 605–622. [Google Scholar] [CrossRef] [Green Version]
- Lugano, R.; Ramachandran, M.; Dimberg, A. Tumor angiogenesis: Causes, consequences, challenges and opportunities. Cell. Mol. Life Sci. CMLS 2020, 77, 1745–1770. [Google Scholar] [CrossRef] [Green Version]
- Tolaney, S.M.; Boucher, Y.; Duda, D.G.; Martin, J.D.; Seano, G.; Ancukiewicz, M.; Barry, W.T.; Goel, S.; Lahdenrata, J.; Isakoff, S.J.; et al. Role of vascular density and normalization in response to neoadjuvant bevacizumab and chemotherapy in breast cancer patients. Proc. Natl. Acad. Sci. USA 2015, 112, 14325–14330. [Google Scholar] [CrossRef] [Green Version]
- Iakovlev, V.V.; Gabril, M.; Dubinski, W.; Scorilas, A.; Youssef, Y.M.; Faragalla, H.; Kovacs, K.; Rotondo, F.; Metias, S.; Arsanious, A.; et al. Microvascular density as an independent predictor of clinical outcome in renal cell carcinoma: An automated image analysis study. Lab. Investig. 2012, 92, 46–56. [Google Scholar] [CrossRef] [Green Version]
- Niemiec, J.; Sas-Korczynska, B.; Harazin-Lechowska, A.; Martynow, D.; Adamczyk, A. Lymphatic and Blood Vessels in Male Breast Cancer. Anticancer Res. 2015, 35, 1041–1048. [Google Scholar]
- Mohammed, Z.M.A.; Orange, C.; McMillan, D.C.; Mallon, E.; Doughty, J.C.; Edwards, J.; Going, J.J. Comparison of visual and automated assessment of microvessel density and their impact on outcome in primary operable invasive ductal breast cancer. Hum. Pathol. 2013, 44, 1688–1695. [Google Scholar] [CrossRef]
- Haisan, A.; Rogojanu, R.; Croitoru, C.; Jitaru, D.; Tarniceriu, C.; Danciu, M.; Carasevici, E. Digital microscopy assessment of angiogenesis in different breast cancer compartments. BioMed Res. Int. 2013, 2013, 286902. [Google Scholar] [CrossRef]
- Entenberg, D.; Oktay, M.H.; D’Alfonso, T.; Ginter, P.S.; Robinson, B.D.; Xue, X.; Rohan, T.E.; Sparano, J.A.; Jones, J.G.; Condeelis, J.S. Validation of an Automated Quantitative Digital Pathology Approach for Scoring TMEM: A Prognostic Biomarker for Metastasis. Cancers 2020, 12, 846. [Google Scholar]
- Den Uil, S.H.; van den Broek, E.; Coupé, V.M.H.; Vellinga, T.T.; Delis-van Diemen, P.M.; Bril, H.; Belt, E.J.T.; Kranenburg, O.; Stockmann, H.B.A.C.; Belien, J.A.M.; et al. Prognostic value of microvessel density in stage II and III colon cancer patients: A retrospective cohort study. BMC Gastroenterol. 2019, 19, 146. [Google Scholar] [CrossRef]
- Buchberger, E.; Payrhuber, D.; El Harchi, M.; Zagrapan, B.; Scheuba, K.; Zommer, A.; Bugyik, E.; Dome, B.; Kral, J.B.; Schrottmaier, W.C.; et al. Inhibition of the transcriptional repressor complex Bcl-6/BCoR induces endothelial sprouting but does not promote tumor growth. Oncotarget 2017, 8, 552–564. [Google Scholar] [CrossRef] [Green Version]
- Tzeng, H.T.; Tsai, C.H.; Yen, Y.T.; Cheng, H.C.; Chen, Y.C.; Pu, S.W.; Wang, Y.S.; Shan, Y.S.; Tseng, Y.L.; Su, W.C.; et al. Dysregulation of Rab37-Mediated Cross-talk between Cancer Cells and Endothelial Cells via Thrombospondin-1 Promotes Tumor Neovasculature and Metastasis. Clin. Cancer Res. 2017, 23, 2335–2345. [Google Scholar] [CrossRef] [Green Version]
- Kather, J.N.; Marx, A.; Reyes-Aldasoro, C.C.; Schad, L.R.; Zöllner, F.G.; Weis, C.A. Continuous representation of tumor microvessel density and detection of angiogenic hotspots in histological whole-slide images. Oncotarget 2015, 6, 19163–19176. [Google Scholar] [CrossRef] [Green Version]
- Marinaccio, C.; Giudice, G.; Nacchiero, E.; Robusto, F.; Opinto, G.; Lastilla, G.; Maiorano, E.; Ribatti, D. Interval sentinel lymph nodes in melanoma: A digital pathology analysis of Ki67 expression and microvascular density. Clin. Exp. Med. 2016, 16, 383–389. [Google Scholar] [CrossRef]
- Di Maggio, F.; Arumugam, P.; Delvecchio, F.R.; Batista, S.; Lechertier, T.; Hodivala-Dilke, K.; Kocher, H.M. Pancreatic stellate cells regulate blood vessel density in the stroma of pancreatic ductal adenocarcinoma. Pancreatology 2016, 16, 995–1004. [Google Scholar] [CrossRef] [Green Version]
- Schraml, P.; Athelogou, M.; Hermanns, T.; Huss, R.; Moch, H. Specific immune cell and lymphatic vessel signatures identified by image analysis in renal cancer. Mod. Pathol. 2019, 32, 1042–1052. [Google Scholar] [CrossRef]
- Arimoto, A.; Uehara, K.; Tsuzuki, T.; Aiba, T.; Ebata, T.; Nagino, M. Role of bevacizumab in neoadjuvant chemotherapy and its influence on microvessel density in rectal cancer. Int. J. Clin. Oncol. 2015, 20, 935–942. [Google Scholar] [CrossRef]
- Lee, S.Y.; Chao-Nan, Q.; Seng, O.A.; Peiyi, C.; Bernice, W.H.M.; Swe, M.S.; Chii, W.J.; Jacqueline, H.S.G.; Chee, S.K. Changes in specialized blood vessels in lymph nodes and their role in cancer metastasis. J. Transl. Med. 2012, 10, 206. [Google Scholar] [CrossRef] [Green Version]
Figure 1.
A representative example of high-dimensional automated tissue cytometry shown on a colon sample stained for seven markers. (a) Original multicolor immunofluorescence image data set acquired by a multispectral imaging technology. Nuclei stained by 4′,6-diamidino-2-phenylindole (DAPI) in blue; immune markers/immune checkpoint markers CD4 in green/PD-L1 in yellow/PD1 in red/CD68 in pink/CD8 in orange; pan-cytokeratin marker in turquoise. As this raw data image contains overlapping emission signals from the fluorochromes, the colors appear mixed. (b) Image with clearly separated fluorescent signals obtained by a mathematical procedure referred to as spectral unmixing. (c) Nuclei detection, highlighted by the green contour mask shown in overlay to the original image. (d) Metastructure detection of epithelial cells, highlighted in orange overlay. (e) Proximity measurements in relation to detected metastructures with various distance zones highlighted by different colors. (f) Analysis of spatial connections among and between single cells of a specific cellular phenotype highlighted by a green mask and white connecting lines. The images were provided by and analyzed using TissueGnostics’ image cytometry solution StrataQuest.

Figure 2.
A representative example of automated analysis of fluorescence in situ hybridization (FISH) and RNA in situ hybridization (ISH) stained cells using a next-generation digital pathology platform. (a) FISH staining (blue, nuclei stained for 4′,6-diamidino-2-phenylindole (DAPI); red and yellow dots, FISH probes); on the left the original image is shown, in the middle the corresponding analyzed image including cell and dot detection mask, and on the right the analyzed data visualized in a scattergram. (b) RNAscope staining (blue, nuclei stained for hematoxylin; brown, RNAscope staining); on the left the original image is shown, in the middle the original image overlaid with the detected dot mask, and on the right the original image overlaid with the nuclei mask, the cellular mask, and the identified dot mask. Both images were provided by and analyzed using TissueGnostics’ image cytometry solution StrataQuest.

Figure 3.
Analysis of the tumor immune microenvironment using next-generation digital pathology. A representative example of the automated detection of CD8+ immune cells within the tumor microenvironment of ovarian cancer by Developer XD (Definiens, Munich, Germany). Figure adapted from Desbois et al., 2020 [153].


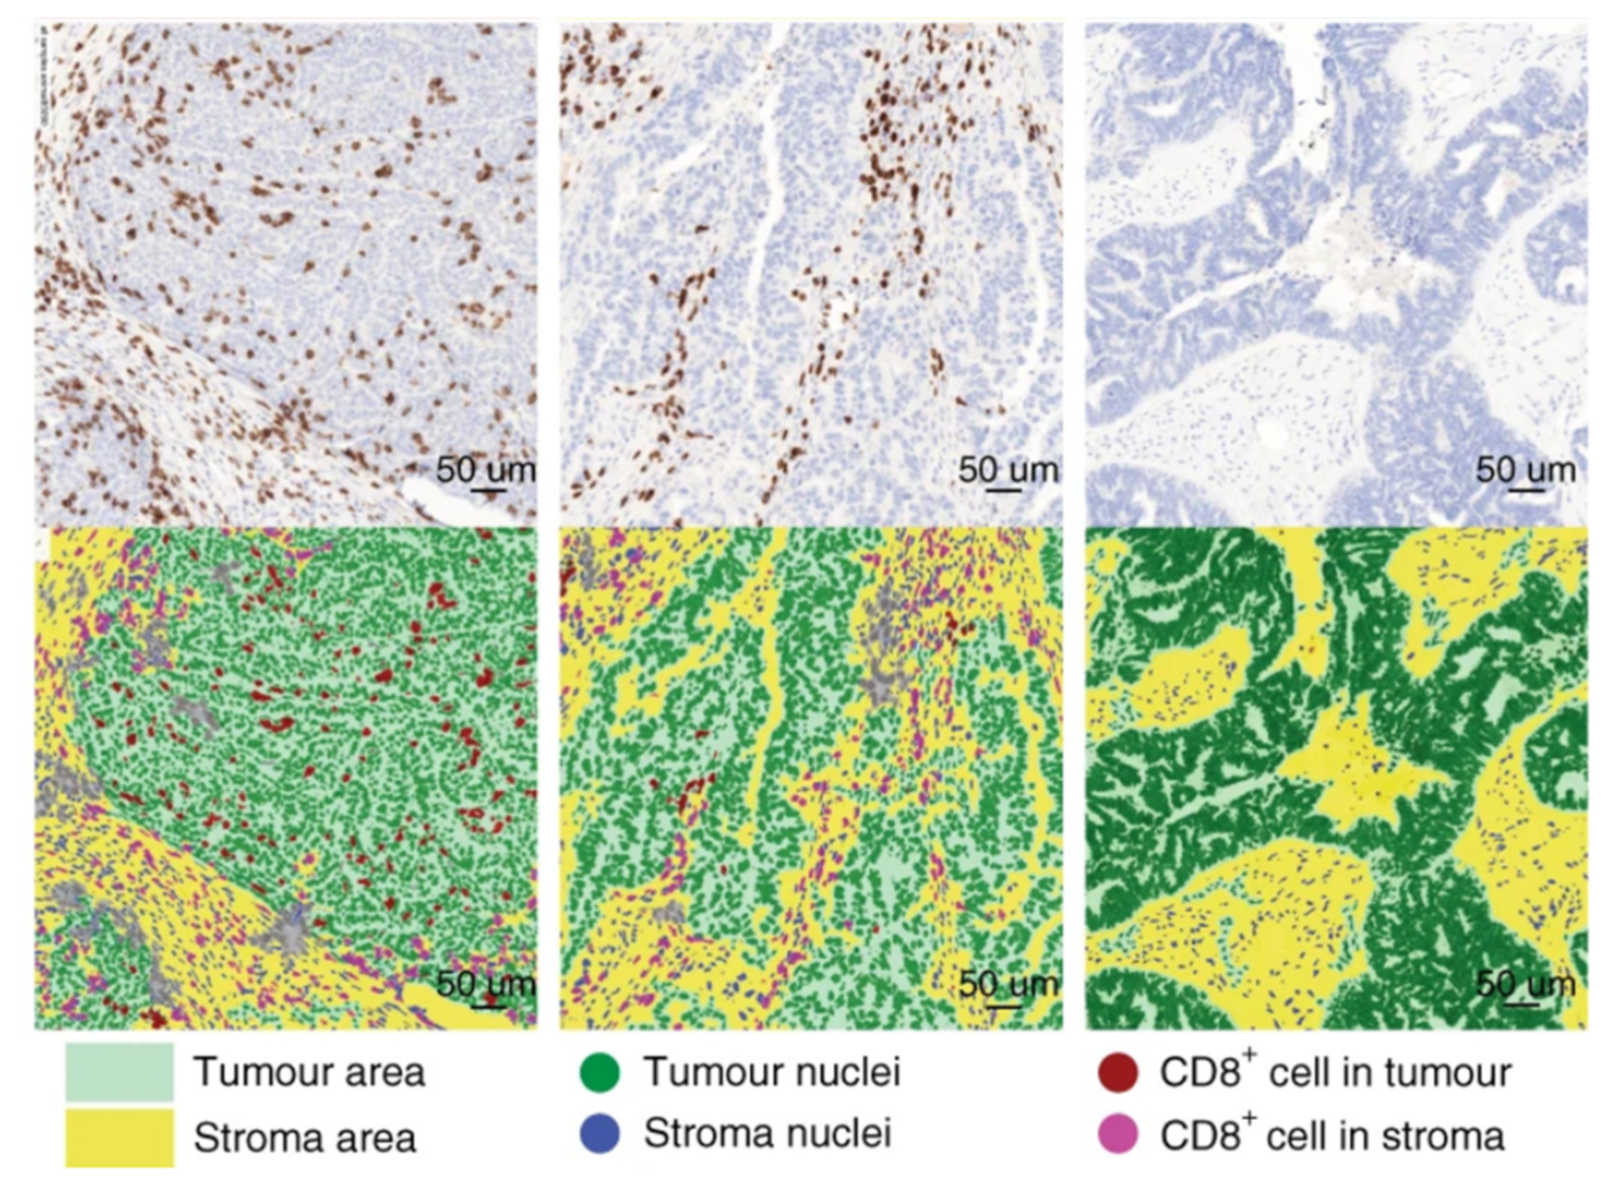
Table 1.
IHC and IF multiplexing techniques.
| Method | Process | Advantages | Disadvantages | References |
|---|---|---|---|---|
| MICSSS (IHC) | Multiple staining rounds; AEC removal AEC with organic solvent-based destaining buffer; imaging |
|
| [29] |
| SIMPLE (IHC) | Multiple staining rounds; AEC removal with organic solvent-based destaining buffer; imaging |
|
| [28] |
| Opal mIHC (IF) | sequential staining with AB tagged with TSA conjungated fluorescence molecules, AB removal by heat-treated antibody stripping; imaging |
|
| [30] |
| In silico multiplexing workflow (IF) | Multiple staining rounds; Dye inactivation by bleaching with alkaline solution + H2O2; imaging |
|
| [31] |
| t-Cycif (IF) | Multiple staining rounds (like MxIF); bleaching by hydrogen peroxide, intense light and high pH; imaging |
|
| [32] |
| MxIF (IF) | Multiple staining rounds; Alkaline oxidation chemistry was developed that eliminates cyanine-based dye fluorescence within 15 min; imaging |
|
| [33] |
| MELC (IF) | Multiple automatic staining rounds; during each cycle the sample is incubated with one or more tags and imaged before bleaching by soft multi-wavelength excitation |
|
| [35] |
| CODEX (IF) | Antibodies conjugated to a CODEX barcode; visualized by the binding of highly specific corresponding dye-labeled CODEX reporter |
|
| [34] |
| NanoString (IF) | Antibodies conjugated to a barcode; visualized by the binding of highly specific corresponding dye-labeled reporter |
|
| [26] |
AB, antibody; AEC, 3-amino-9-ethylcarbazole; CODEX, co detection by indexing; IF, immunofluorescence; IHC, immunohistochemistry; MELC, multi-epitope-ligand cartography; MICSSS, multiplexed immunohistochemical consecutive staining on a single slide; SIMPLE, sequential immunoperoxidase labelling and erasing method; TSA, tyramide signal amplification system; t-Cycif, tissue-based cyclic immunofluorescence.
Table 2.
Studies using next-generation digital pathology for the assessment of the tumor immune microenvironment.
Table 2.
Studies using next-generation digital pathology for the assessment of the tumor immune microenvironment.
| Cancer Type | Markers | Scanner/Microscope | Quantification System | Reference |
|---|---|---|---|---|
| Breast cancer | CD4, CD8, Foxp3 | Olympus BX51 (Olympus, Tokyo, Japan) | UTHSCSA Image Tool (University of Texas Health Science Center at San Antonio, San Antonio, TX, USA) | [102] |
| Breast cancer | CD4, CD8, CD3, CD20, FOXP3, CD68 | Leica SCN400 F (Leica Biosystems Inc., Richmond, IL, USA) | ImageJ software (NIH, Bethesda, MD, USA) | [103] |
| Breast cancer | PD-L1 | Aperio AT2 Scanner (Leica Biosystems Inc., Richmond, IL, USA) | QuPath (University of Edinburgh, Edinburgh, UK) | [104] |
| Breast cancer | CD8 | ScanScope XT (Aperio Technologies, Vista, CA, USA) | HALO (Indica Labs, Albuquerque, NM, USA) | [105] |
| Breast cancer | CD3, CD20, Foxp3 | NanoZoomer (Hamamatsu Photonics, Hamamatsu City, Japan); Panoramic 250 Flash (3Dhistech, Budapest, Hungary) | ImageJ software (NIH, Bethesda, MD, USA) | [106] |
| Breast cancer | CD3, CD8, CD20 | NanoZoomer (Hamamatsu Photonics, Hamamatsu City, Japan) | ImageJ software (NIH, Bethesda, MD, USA) | [107] |
| Breast cancer | CD4, CD68, CD8, FOXP3, PD-L1 | Vectra 3 (PerkinElmer, Waltham, MA, USA) | inForm (PerkinElmer, Waltham, MA, USA) | [108] |
| Breast cancer | CD4, CD8, FOXP3, CD20, CD33, PD-1 | Vectra 3 (Akoya Biosciences, Marlborough, MA, USA) | inForm (Akoya, Marlborough, MA, USA) | [109] |
| CRC | CD3, CD8 | n.s. | Developer XD (Definiens, Munich, Germany) | [101] |
| CRC | CD3, CD8 | VENTANA iScan HT (Roche, Basel, Switzerland) | automated image analysis algorithm | [110] |
| CRC | CD8 | Aperio XT Scanner (Leica Biosystems Inc., Richmond, IL, USA) | HALO (Indica Labs, Albuquerque, NM, USA) | [105] |
| CRC | CD3, CD8 | Zeiss Axio Scan.Z1 (Zeiss, Jena, Germany) | HALO (Indica Labs, Albuquerque, NM, USA) | [111] |
| CRC | CD3, CD4, CD8, CD45RO, FOXP3, Granzyme B, CD15, CD20, S100, CD68, IL17, CD57, | microscope (Leica, Wetzlar, Germany) | TMAJ software (Johns Hopkins University, Baltimore, MD, USA) | [112] |
| CRC | FoxP3, CD8, CD66b, CD20, CD68 | Vectra 3 (PerkinElmer, Waltham, MA, USA) | inForm (PerkinElmer, Waltham, MA, USA) | [113] |
| CRC | SOX2, CD3, CD8 FoxP3, ALDH1, CD44v6, CD133, Lgr5, PD-L1 | Aperio XT Scanner (Leica Biosystems Inc., Richmond, IL, USA) | Aperio Imagescope (Leica Biosystems Inc., Richmond, IL, USA) | [114] |
| CRC | CD8, CD11c, PD-L1 | Pannoramic MIDI II (3Dhistech, Budapest, Hungary) | StrataQuest (TissueGnostics, Vienna, Austria) | [115] |
| CRC | CD8, CD4, CD20, Foxp3, CD45RO, | Vectra Polaris (PerkinElmer, Waltham, MA, USA) | inForm (PerkinElmer, Waltham, MA, USA) | [116] |
| CRC, CRCLM | CD20, CD3, Ki67, CD27 | TissueFAXS PLUS (TissueGnostics, Vienna, Austria) | HistoQuest, TissueQuest (TissueGnostics, Vienna, Austria) | [117] |
| CRC, CRCLM | CD8, Foxp3, CD68, CD31 | ScanScope (Aperio Technologies, Vista, CA, USA) | GENIE (Aperio Technologies, Vista, CA, USA) | [99] |
| CRCLM | CD45, CD20 | TissueFAXS PLUS (TissueGnostics, Vienna, Austria) | HistoQuest, TissueQuest (TissueGnostics, Vienna, Austria) | [118] |
| CRCLM | CD3, CD4, CD8, CD20, CD68 | NanoZoomer (Hamamatsu Photonics, Hamamatsu City, Japan) | Visilog 9.0 software (Noesis, Saclay, France) | [119] |
| CRCLM | CD3, CD8, CD45RO, Foxp3, CD20 | NanoZoomer (Hamamatsu Photonics, Hamamatsu City, Japan) | Developer XD (Definiens, Munich, Germany) | [120] |
| Gastric cancer | PD-L1, CD8 | digital slide scanner (3Dhistech, Budapest, Hungary); TissueFAXS (TissueGnostics, Vienna, Austria) | QuantCenter (3Dhistech, Budapest, Hungary); TissueQuest (TissueGnostics, Vienna, Austria) | [121] |
| Gastric cancer | CD68, CD163, CD3, MPO, Foxp3. | ScanScope CS (Aperio Technologies, Vista, CA, USA) | ImageScope (Aperio Technologies, Vista, CA, USA) | [122] |
| Gastric cancer | CD3, CD4, CD8, PD-1 | ScanScope CS2 (Aperio Technologies, Vista, CA, USA) | ImageScope (Aperio Technologies, Vista, CA, USA) | [122] |
| Gastric cancer | CD8, FoxP3 | ScanScope XT (Aperio Technologies, Vista, CA, USA) | image analysis system—ScanScope XT (Aperio Technologies, Vista, CA, USA) | [123] |
| Gastric cancer | CD8, Foxp3 | n.s. | Aperio image analysis system (Leica Biosystems Inc., Richmond, IL, USA) | [124] |
| Gastric cancer | CD8, Foxp3, CD3, CD56 | Vectra Multispectral Imaging System version 2 (PerkinElmer, Waltham, MA, USA) | inForm (PerkinElmer, Waltham, MA, USA) | [125] |
| Gastric and esophageal cancer | CD3, CD8 | n.s. | HALO (Indica Labs, Albuquerque, NM, USA | [126] |
| Gastric cancer and metastasis | PD-L1 | n.s. | Aperio Imagescope IHC Membrane Image Analysis software (Aperio Technologies, Vista, CA, USA) | [127] |
| HCC | CD3, CD8 | n.s. | ImagePro Plus (Media Cybernetics, Rockville, MD, USA) | [128] |
| HCC | CD3, CD8 | Nikon E600 (Nikon, Tokyo, Japan); | ImageJ software (NIH, Bethesda, MD, USA) | [129] |
| HCC | CD3, CD15, CD20, CD23, CD68, Foxp3, LTß | Ariol SL-50 (Applied Imaging) | Image analysis system (Applied Imaging) | [4] |
| HCC | CD3, CD8, PD-1, TIM3 | Vectra 3 (PerkinElmer, Waltham, MA, USA) | inForm (PerkinElmer, Waltham, MA, USA) | [130] |
| HCC | CD3, CD4, CD8, CD20, CD27, CD40, CD38, CD56, CD68, CD138, S100, Granzyme B, Ki67 | Mantra (PerkinElmer, Waltham, MA, USA) | ImagePro Plus (Media Cybernetics, Rockville, MD, USA) | [131] |
| HCC | CD3, CD8, CD45RO, | n.s. | ImagePro Plus (Media Cybernetics, Rockville, MD, USA) | [132] |
| HCC | FoxP3, CD4, CD8, CD34 | Olympus BX51 (Olympus, Tokyo, Japan) | ImagePro Plus (Media Cybernetics, Rockville, MD, USA) | [133] |
| HNSCC | FOXP3, CD8 | n.s. | Visiopharm image analysis software (Visiopharm, Copenhagen, Denmark) | [134] |
| HNSCC | CD3, CD8 | Aperio AT2 scanner (Leica Biosystems Inc., Richmond, IL, USA) | StrataQuest (TissueGnostics, Vienna, Austria) | [135] |
| Melanoma | PD-L1 | Philips Ultra Fast Scanner 300 (Philips, Amsterdam, Netherlands) | HALO (Indica Labs, Albuquerque, NM, USA | [136] |
| Melanoma | CD20 | TissueFAXS (TissueGnostics, Vienna, Austria) | HistoQuest (TissueGnostics, Vienna, Austria) | [137] |
| Melanoma | CD3, CD8, CD68, SOX10, Ki67 | Mantra (PerkinElmer, Waltham, MA, USA) | inForm (PerkinElmer, Waltham, MA, USA) | [138] |
| Melanoma | CD19, CD20, CD27, CD38, CD138, CD5, CD8, Foxp3, CD4, CD69, CD103, CD45RO, CXCL13, CD21, CD23, Bcl6 | Vectra Multispectral Imaging System version 2 (PerkinElmer, Waltham, MA, USA) | inForm (PerkinElmer, Waltham, MA, USA) | [139] |
| NSCLC | CD8, PD-1 | Philips Ultra Fast Scanner 300 (Philips, Amsterdam, Netherlands) | HALO (Indica Labs, Albuquerque, NM, USA | [140] |
| NSCLC | CD8 | NanoZoomer (Hamamatsu Photonics, Hamamatsu City, Japan) | Calopix software (TRIBVN Healthcare, Paris, France) | [141] |
| NSCLC | PD-L1, TIM, CD3, CD4, CD8, CD57, granzyme B, CD45RO, PD-1, FOXP3 | Aperio AT scanner (Leica Biosystems Inc., Richmond, IL, USA) | Aperio GENIE (Leica Biosystems Inc., Richmond, IL, USA) | [142] |
| NSCLC | CD8, CD4, FOXP3, CD163, CCL17, IL-13 | Vectra Automated Quantitative Pathology Imaging System (PerkinElmer, Waltham, MA, USA) | [143] | |
| NSCLC | CD3, CD4, CD8, CD57, granzyme B, CD45RO, PD-1, FOXP3, CD68 | Aperio AT scanner (Leica Biosystems Inc., Richmond, IL, USA) | Aperio GENIE (Leica Biosystems Inc., Richmond, IL, USA) | [144] |
| NSCLC | CD4, CD20, CD8, Foxp3 | NanoZoomer (Hamamatsu Photonics, Hamamatsu City, Japan) | Tissue Studio (Definiens, Munich, Germany) | [145] |
| NSCLC | CD68, CD163, PD-L1, | Mantra (PerkinElmer, Waltham, MA, USA) | inForm (PerkinElmer, Waltham, MA, USA) | [146] |
| NSCLC | CD8, CD4, Foxp3, CD68 | Vectra Multispectral Imaging System (PerkinElmer, Waltham, MA, USA) | inForm (PerkinElmer, Waltham, MA, USA) | [147] |
| NSCLC | CD3, CD8, Foxp3 | ScanScope CS (Aperio Technologies, Vista, CA, USA) | GENIE (Aperio Technologies, Vista, CA, USA) | [148] |
| NSCLC | CD8, PD-L1 | Aperio AT scanner (Leica Biosystems Inc., Richmond, IL, USA) | Developer XD (Definiens, Munich, Germany) | [149] |
| pulmonary squamous cell carcinoma | CD8, PD-1 | ScanScope (Aperio Technologies, Vista CA, USA) | ImageScope (Aperio Technologies, Vista, CA, USA) | [150] |
| pulmonary squamous cell carcinoma | CD20, CD21, CD23, PNAD, DC-LAMP | Vectra 3 (PerkinElmer, Waltham, MA, USA) | inForm (PerkinElmer, Waltham, MA, USA) | [151] |
| Oral squamous cell cancer | CD3, CD8, FoxP3, CD163, PD-L1 | Vectra (PerkinElmer, Waltham, MA, USA) | inForm (PerkinElmer, Waltham, MA, USA) | [152] |
| Ovarian cancer | CD8, MHC I, FAP ISH | Panoramic 250 (3Dhistech, Budapest, Hungary), | Developer XD (Definiens, Munich, Germany) | [153] |
| Ovarian cancer | CD8 | TissueFAXS (TissueGnostics, Vienna, Austria) | HistoQuest (TissueGnostics, Vienna, Austria) | [154] |
| Ovarian cancer | CD8, CD45RO, CD68 | Panoramic Flash (3Dhistech, Budapest, Hungary) | Tissue Studio (Definiens, Munich, Germany) | [155] |
| Ovarian cancer | CD4, CD8, CD20 | Aperio scanner (Leica Biosystems Inc., Richmond, IL, USA) | ImageScope (Aperio Technologies, Vista, CA, USA) | [156] |
| Ovarian cancer | CD8 | Vectra (PerkinElmer, Waltham, MA, USA) | inForm (PerkinElmer, Waltham, MA, USA) | [157] |
| Ovarian cancer | CD8, CD103 | TissueFAXS (TissueGnostics, Vienna Austria) | Fiji, Image J software (NIH, Bethesda, MD, USA) | [158] |
| Ovarian cancer | CD3, CD4, CD8 | n.s. | CD3 Quantifier (VM Scope, Berlin, Germany) | [159] |
| Pancreatic cancer | CD3, CD8, CD4, Foxp3, CK8 | Vectra Multispectral Imaging System version 2 (PerkinElmer, Waltham, MA, USA) | Nuance Image Analysis software; inForm (PerkinElmer, Waltham, MA, USA) | [160] |
| Pancreatic cancer | DC-LAMP, FoxP3, CD68, CD3, CD8, CD4, CD20 | Panoramic Flash (3Dhistech, Budapest, Hungary) | ImageJ software (NIH, Bethesda, MD, USA) | [161] |
| Pancreatic cancer | CD20, CD8, PD1 | dotSlide (Olympus, Tokyo, Japan) | ad hoc software | [162] |
| Pancreatic cancer | CD8 | NanoZoomer (Hamamatsu Photonics, Hamamatsu City, Japan) | HALO (Indica Labs, Albuquerque, NM, USA | [163] |
| Pancreatic cancer | CD8, PD-L1, CD44, CD133 | TissueFAXS (TissueGnostics, Vienna, Austria) | TissueQuest (TissueGnostics, Vienna, Austria) | [164] |
| Pancreatic cancer | CD3 | NanoZoomer (Hamamatsu Photonics, Hamamatsu City, Japan) | Tissue Studio (Definiens, Munich, Germany) | [165] |
| Pancreatic cancer | CD3, CD8, CD20, CD66b | n.s. | ImageJ software (NIH, Bethesda, MD, USA) | [166] |
| Pancreatic cancer | CD3, CD8 | Aperio AT scanner (Leica Biosystems Inc., Richmond, IL, USA) | ImageJ software (NIH, Bethesda, MD, USA) | [167] |
| Prostate cancer | CD3, CD8, CD20, CD56, CD68, Foxp3 | ScanScope XT(Aperio Technologies, Vista, CA, USA) | ImageScope (Aperio Technologies, Vista, CA, USA) | [168] |
| Prostate cancer | CD20 | ScanScope XT (Aperio Technologies, Vista, CA, USA) | ImageScope (Aperio Technologies, Vista, CA, USA) | [169] |
| Prostate cancer | CD3, CD8, Foxp3 | NanoZoomer (Hamamatsu Photonics, Hamamatsu City, Japan) | Aperio Digital Pathology software (Leica Biosystems Inc., Richmond IL, USA) | [170] |
| Clear cell renal cell carcinoma | CD8, PD-1, LAG-3, PD-L1, PD-L2 | NanoZoomer (Hamamatsu Photonics, Hamamatsu City, Japan) | Calopix software (TRIBVN Healthcare, Paris, France) | [171] |
CRC, colorectal cancer; CRCLM, colorectal cancer metastasis in the liver; HCC, hepatocellular carcinoma; HNSCC, head and neck squamous cell carcinoma; NSCLC, non-small cell lung cancer; n.s., not specified.
Table 3.
Studies using next-generation digital pathology for the quantification of blood vessels.
| Cancer Type | Markers | Scanner/Microscope | Quantification System | References |
|---|---|---|---|---|
| Breast cancer | CD34 | Olympus BX41 (Olympus, Tokyo, Japan) | Cell D software (Olympus, Tokyo, Japan) | [178] |
| Breast cancer | CD34 | NanoZoomer (Hamamatsu Photonics, Hamamatsu City, Japan) | Slidepath Image Analysis system (Leica Biosystems Inc., Richmond, IL, USA) | [179] |
| Breast cancer | CD34 | TissueFAXS (TissueGnostics, Vienna, Austria) | HistoQuest (TissueGnostics, Vienna, Austria) | [180] |
| Breast cancer metastasis | CD31 | Panoramic 250 (3Dhistech, Budapest, Hungary) | Visiopharm image analysis software (Visiopharm, Copenhagen, Denmark) | [181] |
| CRC | CD31 | Mirax slide scanner system (3Dhistech, Budapest, Hungary) | Image J software (NIH, Bethesda, MD, USA) | [182] |
| CRC | CD31 | TissueFAXS (TissueGnostics, Vienna, Austria) | StrataQuest (TissueGnostics, Vienna, Austria) | [183] |
| ESCC | CD31 | TissueFAXS (TissueGnostics, Vienna, Austria) | HistoQuest, TissueQuest (TissueGnostics, Vienna, Austria) | [184] |
| Human tumor | CD31, CD34 | Aperio (Leica Biosystems Inc., Richmond, IL, USA) | Fiji, Image J software (NIH, Bethesda, MD, USA) | [185] |
| Melanoma | CD31 | Aperio CS Scanner (Leica Biosystems Inc., Richmond, IL, USA) | Aperio image analysis system (Leica Biosystems Inc., Richmond, IL, USA) | [186] |
| Pancreatic cancer | CD31 | n.s. | The Ariol™ image analysis system (Genetix, New Milton, England) | [187] |
| Renal cancer | CD34 | Zeiss Axio Scan.Z1 (Zeiss, Jena, Germany) | Developer XD, Tissue Studio (Definiens, Munich, Germany) | [188] |
| Rectal cancer | CD34 | ScanScope CS (Aperio Technologies, Vista, CA, USA) | ImageScope (Aperio Technologies, Vista, CA, USA) | [189] |
| Tongue cancer | PNAd | ScanScope T3 (Aperio Technologies, Vista, CA, USA) | Image J software (NIH, Bethesda, MD, USA) | [190] |
CRC, colorectal cancer; n.s., not specified; ESCC, esophageal squamous cell carcinoma.
Publisher’s Note: MDPI stays neutral with regard to jurisdictional claims in published maps and institutional affiliations. |
© 2021 by the authors. Licensee MDPI, Basel, Switzerland. This article is an open access article distributed under the terms and conditions of the Creative Commons Attribution (CC BY) license (https://creativecommons.org/licenses/by/4.0/).
Share and Cite
MDPI and ACS Style
Mungenast, F.; Fernando, A.; Nica, R.; Boghiu, B.; Lungu, B.; Batra, J.; Ecker, R.C. Next-Generation Digital Histopathology of the Tumor Microenvironment. Genes 2021, 12, 538. https://doi.org/10.3390/genes12040538
AMA Style
Mungenast F, Fernando A, Nica R, Boghiu B, Lungu B, Batra J, Ecker RC. Next-Generation Digital Histopathology of the Tumor Microenvironment. Genes. 2021; 12(4):538. https://doi.org/10.3390/genes12040538
Chicago/Turabian StyleMungenast, Felicitas, Achala Fernando, Robert Nica, Bogdan Boghiu, Bianca Lungu, Jyotsna Batra, and Rupert C. Ecker. 2021. "Next-Generation Digital Histopathology of the Tumor Microenvironment" Genes 12, no. 4: 538. https://doi.org/10.3390/genes12040538
Note that from the first issue of 2016, this journal uses article numbers instead of page numbers. See further details here.